

An integrated functional genomic study of acute phenobarbital exposure in the rat
- PMID: 20053287
- PMCID: PMC2826316
- DOI: 10.1186/1471-2164-11-9
An integrated functional genomic study of acute phenobarbital exposure in the rat
Abstract
Background: Non-genotoxic carcinogens are notoriously difficult to identify as they do not damage DNA directly and have diverse modes of action, necessitating long term in vivo studies. The early effects of the classic rodent non-genotoxic hepatocarcinogen phenobarbital have been investigated in the Fisher rat using a combination of metabolomics and transcriptomics, to investige early stage mechanistic changes that are predictive of longer term pathology.
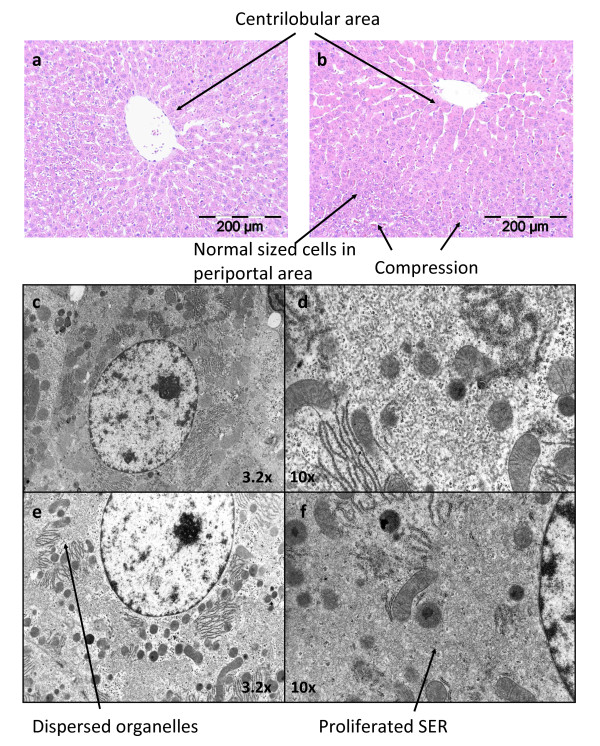
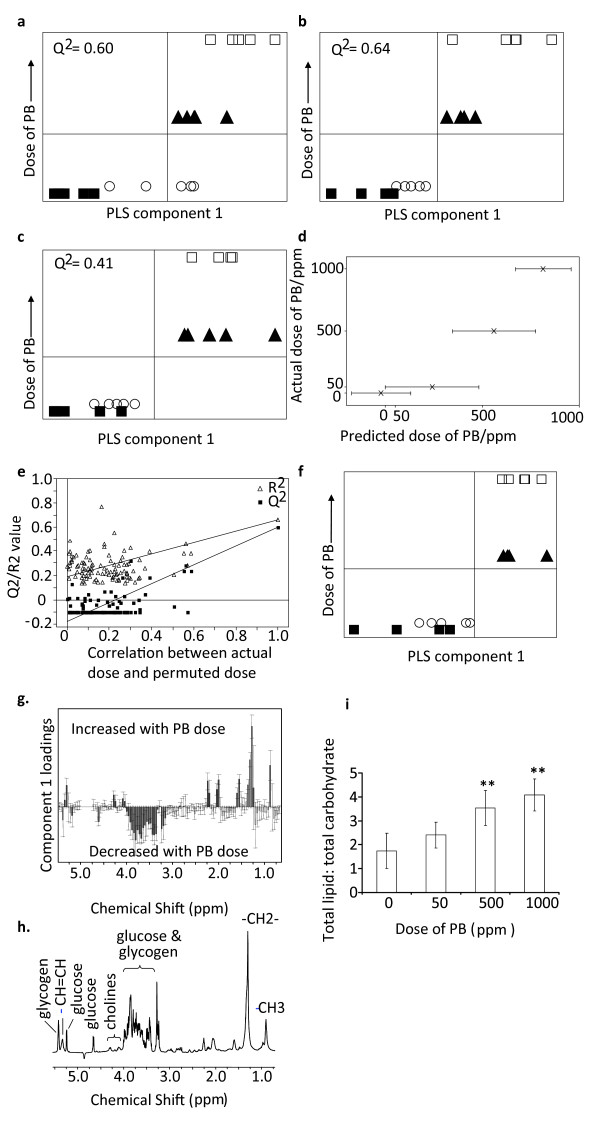
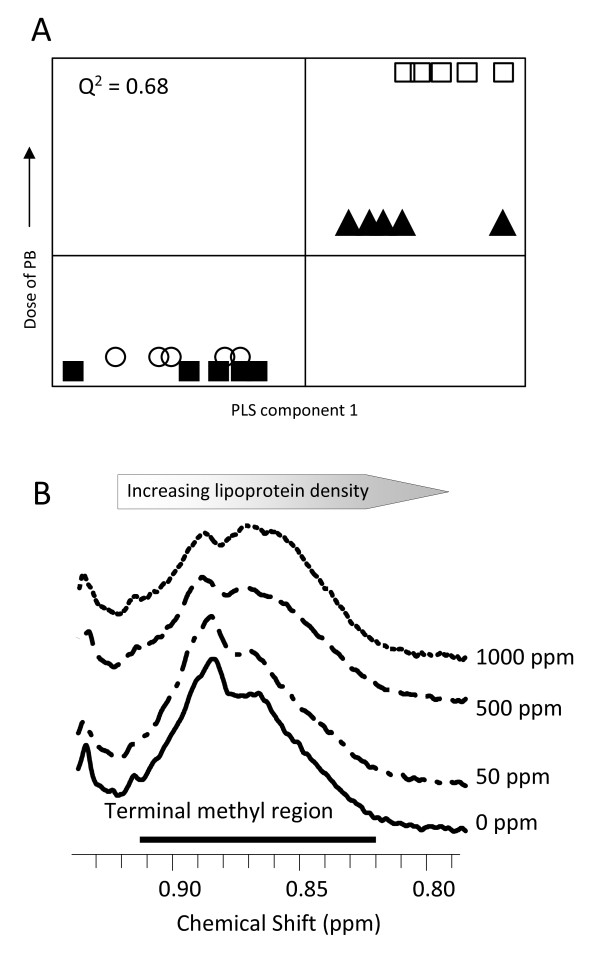
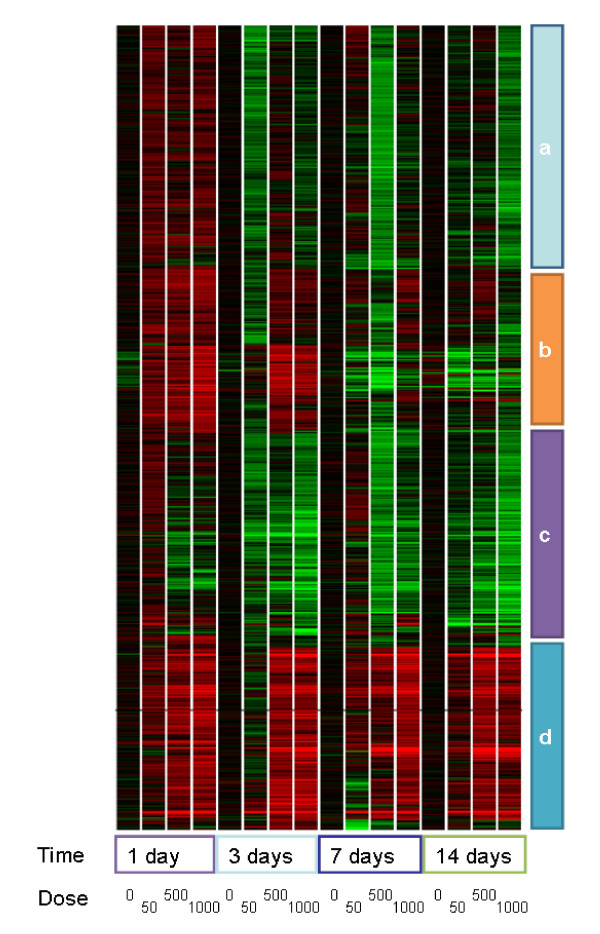
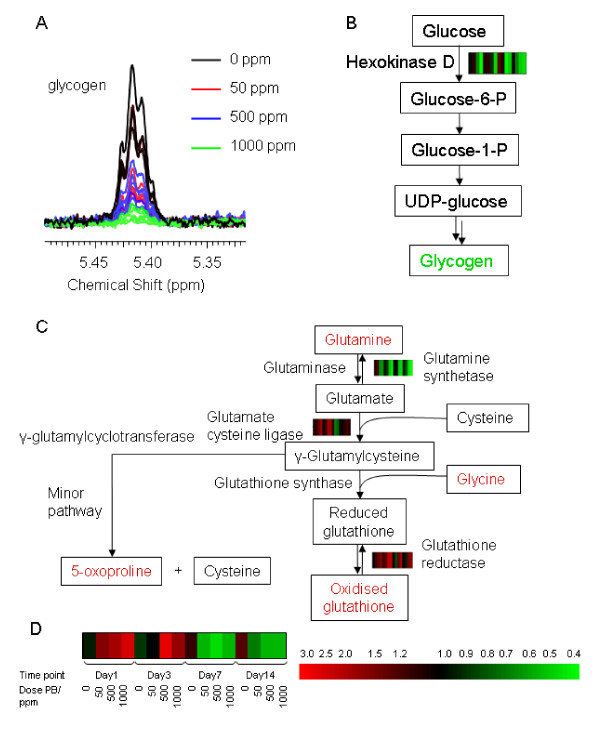
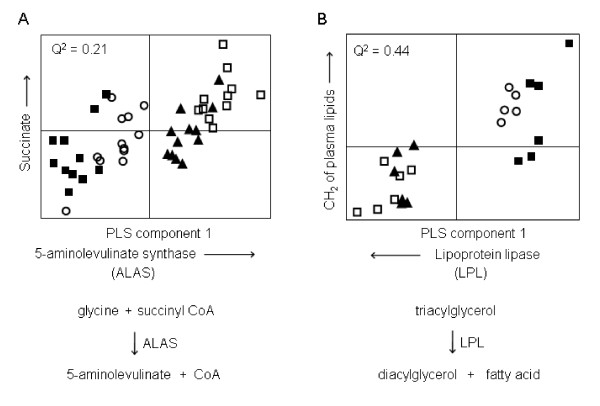
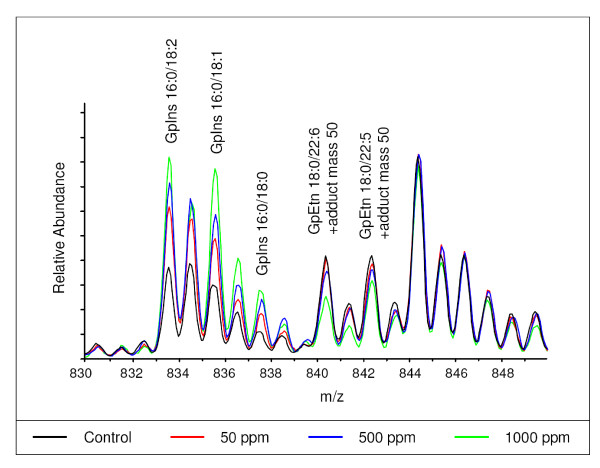
Results: Liver and blood plasma were profiled across 14 days, and multivariate statistics used to identify perturbed pathways. Both metabolomics and transcriptomics detected changes in the liver which were dose dependent, even after one day of exposure. Integration of the two datasets associated perturbations with specific pathways. Hepatic glycogen was decreased due to a decrease in synthesis, and plasma triglycerides were decreased due to an increase in fatty acid uptake by the liver. Hepatic succinate was increased and this was associated with increased heme biosynthesis. Glutathione synthesis was also increased, presumably in response to oxidative stress. Liquid Chromatography Mass Spectrometry demonstrated a remodeling of lipid species, possibly resulting from proliferation of the smooth endoplasmic reticulum.
Conclusions: The data fusion of metabolomic and transcriptomic changes proved to be a highly sensitive approach for monitoring early stage changes in altered hepatic metabolism, oxidative stress and cytochrome P450 induction simultaneously. This approach is particularly useful in interpreting changes in metabolites such as succinate which are hubs of metabolism.
Figures
Similar articles
-
A metabolomics investigation of non-genotoxic carcinogenicity in the rat.J Proteome Res. 2013 Dec 6;12(12):5775-90. doi: 10.1021/pr4007766. Epub 2013 Nov 7. J Proteome Res. 2013. PMID: 24161236 Free PMC article.
-
Subchronic effects of dieldrin and phenobarbital on hepatic DNA synthesis in mice and rats.Fundam Appl Toxicol. 1996 Feb;29(2):219-28. doi: 10.1006/faat.1996.0025. Fundam Appl Toxicol. 1996. PMID: 8742319
-
Human hepatocytes support the hypertrophic but not the hyperplastic response to the murine nongenotoxic hepatocarcinogen sodium phenobarbital in an in vivo study using a chimeric mouse with humanized liver.Toxicol Sci. 2014 Nov;142(1):137-57. doi: 10.1093/toxsci/kfu173. Epub 2014 Aug 21. Toxicol Sci. 2014. PMID: 25145657
-
Formation of 8-hydroxydeoxyguanosine and cell-cycle arrest in the rat liver via generation of oxidative stress by phenobarbital: association with expression profiles of p21(WAF1/Cip1), cyclin D1 and Ogg1.Carcinogenesis. 2002 Feb;23(2):341-9. doi: 10.1093/carcin/23.2.341. Carcinogenesis. 2002. PMID: 11872643
-
A metabonomic characterization of (+)-usnic acid-induced liver injury by gas chromatography-mass spectrometry-based metabolic profiling of the plasma and liver in rat.Int J Toxicol. 2011 Oct;30(5):478-91. doi: 10.1177/1091581811414436. Epub 2011 Aug 30. Int J Toxicol. 2011. PMID: 21878557
Cited by
-
Mode of action and human relevance analysis for nuclear receptor-mediated liver toxicity: A case study with phenobarbital as a model constitutive androstane receptor (CAR) activator.Crit Rev Toxicol. 2014 Jan;44(1):64-82. doi: 10.3109/10408444.2013.835786. Epub 2013 Nov 4. Crit Rev Toxicol. 2014. PMID: 24180433 Free PMC article. Review.
-
Characterization of polybrominated diphenyl ether toxicity in Wistar Han rats and use of liver microarray data for predicting disease susceptibilities.Toxicol Pathol. 2012;40(1):93-106. doi: 10.1177/0192623311429973. Toxicol Pathol. 2012. PMID: 22267650 Free PMC article.
-
A metabolomics investigation of non-genotoxic carcinogenicity in the rat.J Proteome Res. 2013 Dec 6;12(12):5775-90. doi: 10.1021/pr4007766. Epub 2013 Nov 7. J Proteome Res. 2013. PMID: 24161236 Free PMC article.
-
Cerebrospinal fluid metabolomics implicate bioenergetic adaptation as a neural mechanism regulating shifts in cognitive states of HIV-infected patients.AIDS. 2015 Mar 13;29(5):559-69. doi: 10.1097/QAD.0000000000000580. AIDS. 2015. PMID: 25611149 Free PMC article.
-
Metabolomics dataset of PPAR-pan treated rat liver.Data Brief. 2016 May 10;8:196-202. doi: 10.1016/j.dib.2016.05.002. eCollection 2016 Sep. Data Brief. 2016. PMID: 27331087 Free PMC article.
References
-
- Elcombe CR, Odum J, Foster JR, Stone S, Hasmall S, Soames AR, Kimber I, Ashby J. Prediction of rodent nongenotoxic carcinogenesis: evaluation of biochemical and tissue changes in rodents following exposure to nine nongenotoxic NTP carcinogens. Environ Health Perspect. 2002;110(4):363–375. - PMC - PubMed
Publication types
MeSH terms
Substances
Grants and funding
LinkOut - more resources
Full Text Sources
Other Literature Sources
Molecular Biology Databases
