The dynamic architecture of the metabolic switch in Streptomyces coelicolor
- PMID: 20053288
- PMCID: PMC2824715
- DOI: 10.1186/1471-2164-11-10
The dynamic architecture of the metabolic switch in Streptomyces coelicolor
Abstract
Background: During the lifetime of a fermenter culture, the soil bacterium S. coelicolor undergoes a major metabolic switch from exponential growth to antibiotic production. We have studied gene expression patterns during this switch, using a specifically designed Affymetrix genechip and a high-resolution time-series of fermenter-grown samples.
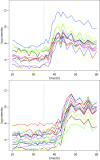
Results: Surprisingly, we find that the metabolic switch actually consists of multiple finely orchestrated switching events. Strongly coherent clusters of genes show drastic changes in gene expression already many hours before the classically defined transition phase where the switch from primary to secondary metabolism was expected. The main switch in gene expression takes only 2 hours, and changes in antibiotic biosynthesis genes are delayed relative to the metabolic rearrangements. Furthermore, global variation in morphogenesis genes indicates an involvement of cell differentiation pathways in the decision phase leading up to the commitment to antibiotic biosynthesis.
Conclusions: Our study provides the first detailed insights into the complex sequence of early regulatory events during and preceding the major metabolic switch in S. coelicolor, which will form the starting point for future attempts at engineering antibiotic production in a biotechnological setting.
Figures


Comment in
-
A technical platform for generating reproducible expression data from Streptomyces coelicolor batch cultivations.Adv Exp Med Biol. 2011;696:3-15. doi: 10.1007/978-1-4419-7046-6_1. Adv Exp Med Biol. 2011. PMID: 21431541
Similar articles
-
Metabolic modeling and analysis of the metabolic switch in Streptomyces coelicolor.BMC Genomics. 2010 Mar 26;11:202. doi: 10.1186/1471-2164-11-202. BMC Genomics. 2010. PMID: 20338070 Free PMC article.
-
cmdABCDEF, a cluster of genes encoding membrane proteins for differentiation and antibiotic production in Streptomyces coelicolor A3(2).BMC Microbiol. 2009 Aug 4;9:157. doi: 10.1186/1471-2180-9-157. BMC Microbiol. 2009. PMID: 19650935 Free PMC article.
-
Cross-regulation among disparate antibiotic biosynthetic pathways of Streptomyces coelicolor.Mol Microbiol. 2005 Dec;58(5):1276-87. doi: 10.1111/j.1365-2958.2005.04879.x. Mol Microbiol. 2005. PMID: 16313616
-
The Gene bldA, a regulator of morphological differentiation and antibiotic production in streptomyces.Arch Pharm (Weinheim). 2015 Jul;348(7):455-62. doi: 10.1002/ardp.201500073. Epub 2015 Apr 27. Arch Pharm (Weinheim). 2015. PMID: 25917027 Review.
-
Molecular regulation of antibiotic biosynthesis in streptomyces.Microbiol Mol Biol Rev. 2013 Mar;77(1):112-43. doi: 10.1128/MMBR.00054-12. Microbiol Mol Biol Rev. 2013. PMID: 23471619 Free PMC article. Review.
Cited by
-
Crp is a global regulator of antibiotic production in streptomyces.mBio. 2012 Dec 11;3(6):e00407-12. doi: 10.1128/mBio.00407-12. mBio. 2012. PMID: 23232715 Free PMC article.
-
Identification of different promoters in the absA1-absA2 two-component system, a negative regulator of antibiotic production in Streptomyces coelicolor.Mol Genet Genomics. 2013 Feb;288(1-2):39-48. doi: 10.1007/s00438-012-0728-2. Epub 2012 Dec 18. Mol Genet Genomics. 2013. PMID: 23247656
-
Competition between the GlnR and PhoP regulators for the glnA and amtB promoters in Streptomyces coelicolor.Nucleic Acids Res. 2013 Feb 1;41(3):1767-82. doi: 10.1093/nar/gks1203. Epub 2012 Dec 16. Nucleic Acids Res. 2013. PMID: 23248009 Free PMC article.
-
Inference of sigma factor controlled networks by using numerical modeling applied to microarray time series data of the germinating prokaryote.Nucleic Acids Res. 2014 Jan;42(2):748-63. doi: 10.1093/nar/gkt917. Epub 2013 Oct 23. Nucleic Acids Res. 2014. PMID: 24157841 Free PMC article.
-
Activation and characterization of a cryptic polycyclic tetramate macrolactam biosynthetic gene cluster.Nat Commun. 2013;4:2894. doi: 10.1038/ncomms3894. Nat Commun. 2013. PMID: 24305602 Free PMC article.
References
-
- Hesketh A, Bucca G, Laing E, Flett F, Hotchkiss G, Smith CP, Chater KF. New pleiotropic effects of eliminating a rare tRNA from Streptomyces coelicolor, revealed by combined proteomic and transcriptomic analysis of liquid cultures. BMC Genomics. 2007;8:261. doi: 10.1186/1471-2164-8-261. - DOI - PMC - PubMed
-
- Lian W, Jayapal KP, Charaniya S, Mehra S, Glod F, Kyung YS, Sherman DH, Hu WS. Genome-wide transcriptome analysis reveals that a pleiotropic antibiotic regulator, AfsS, modulates nutritional stress response in Streptomyces coelicolor A3(2) BMC Genomics. 2008;9:56. doi: 10.1186/1471-2164-9-56. - DOI - PMC - PubMed
Publication types
MeSH terms
Substances
Grants and funding
LinkOut - more resources
Full Text Sources
Other Literature Sources
Molecular Biology Databases

