

Model-guided mutagenesis drives functional studies of human NHA2, implicated in hypertension
- PMID: 20053353
- PMCID: PMC2824056
- DOI: 10.1016/j.jmb.2009.12.055
Model-guided mutagenesis drives functional studies of human NHA2, implicated in hypertension
Abstract
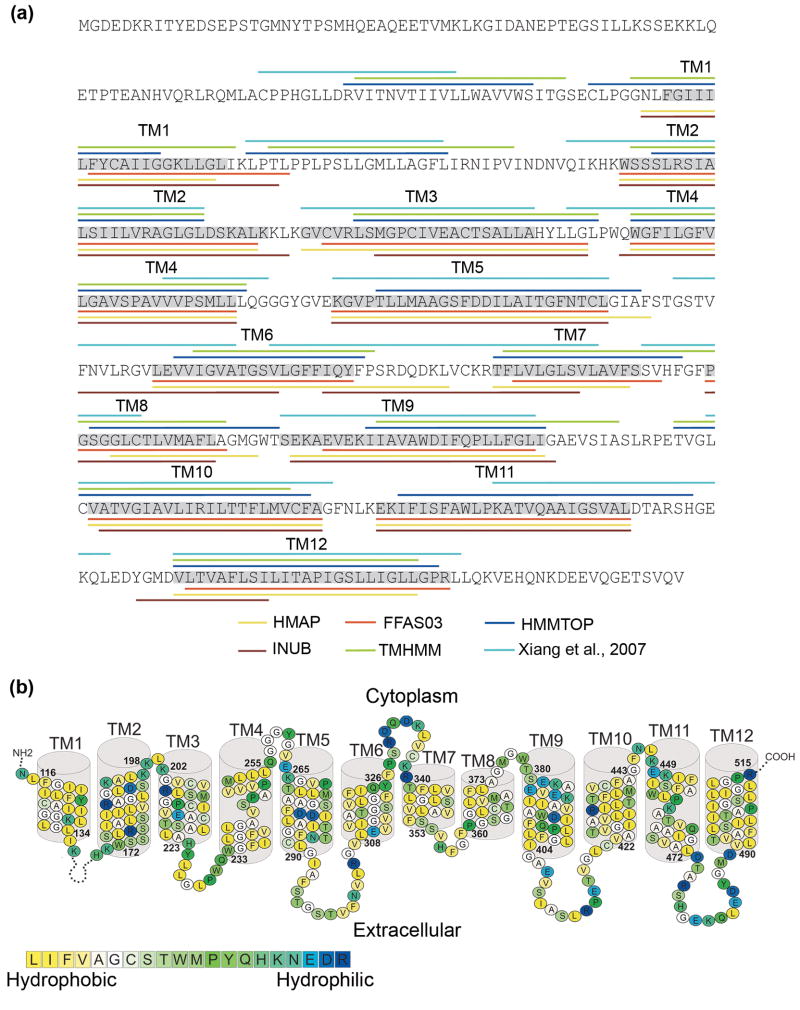
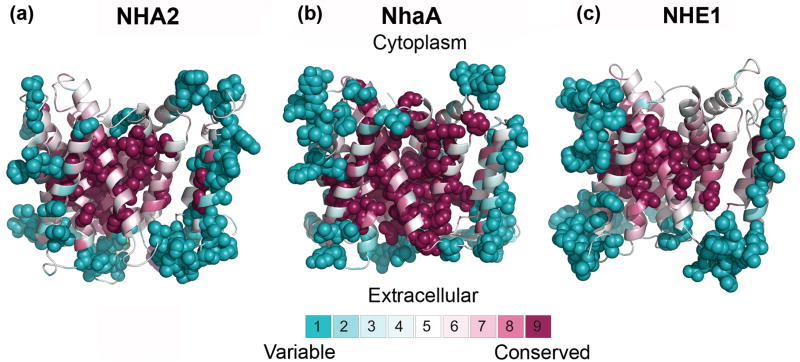
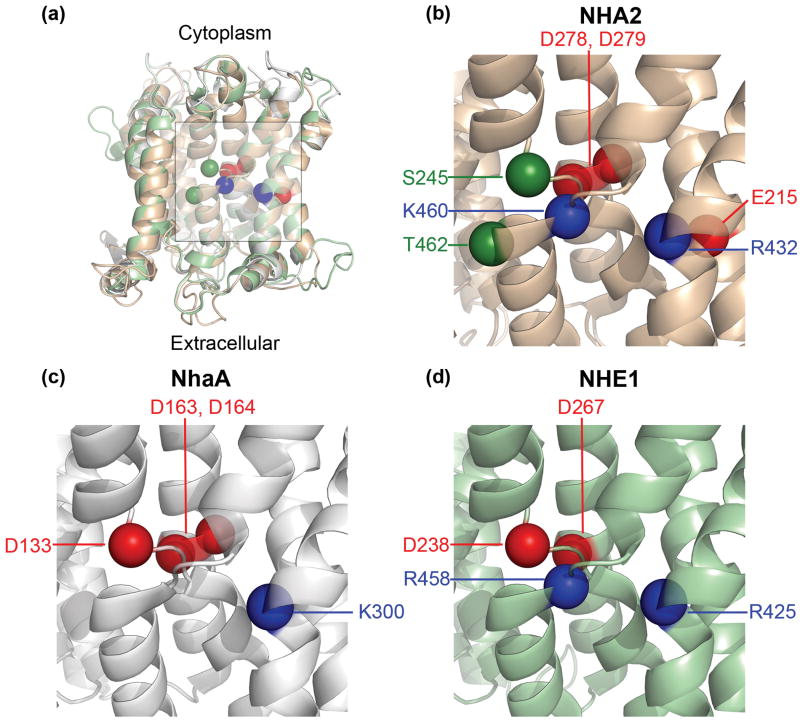
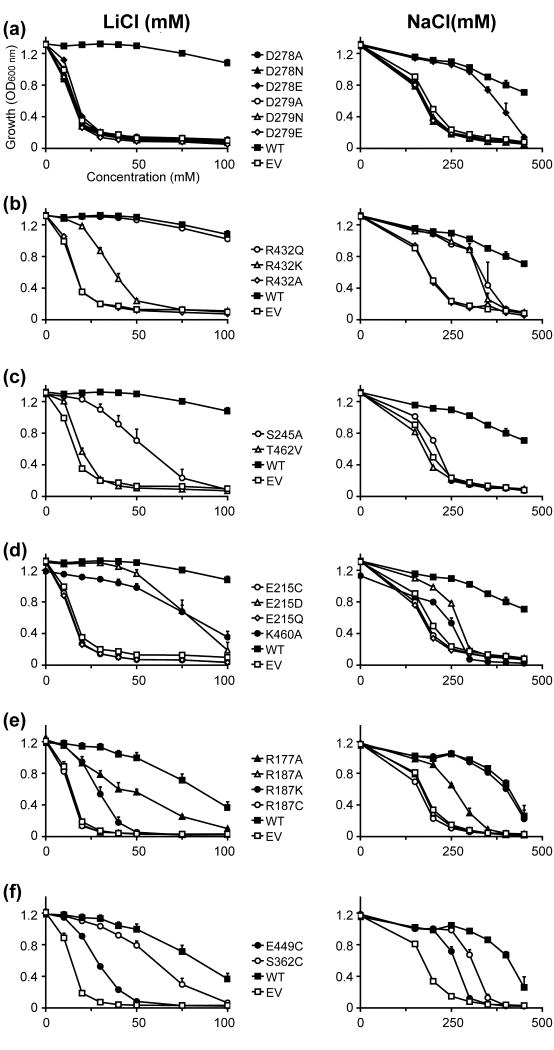
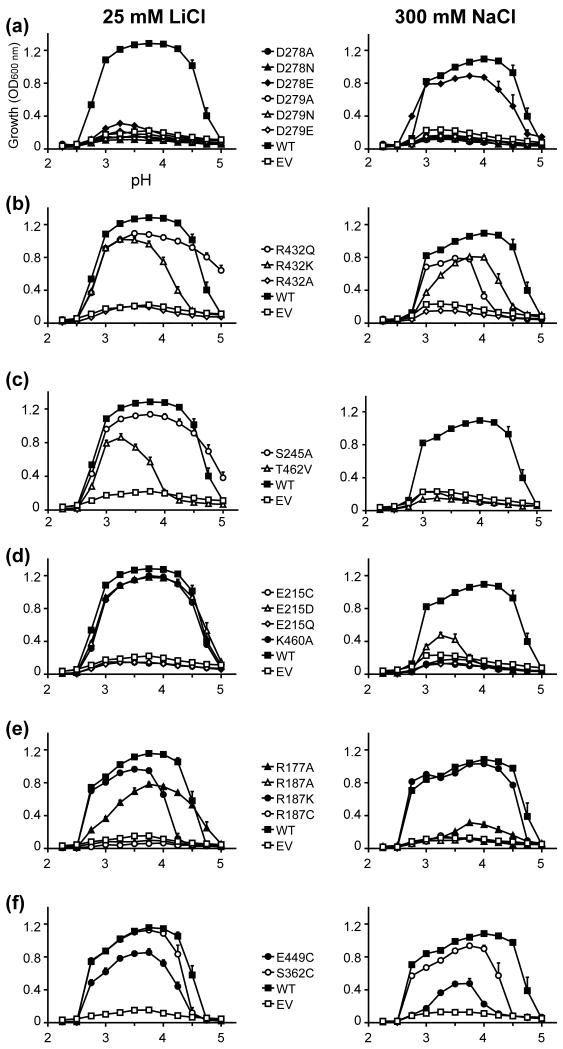
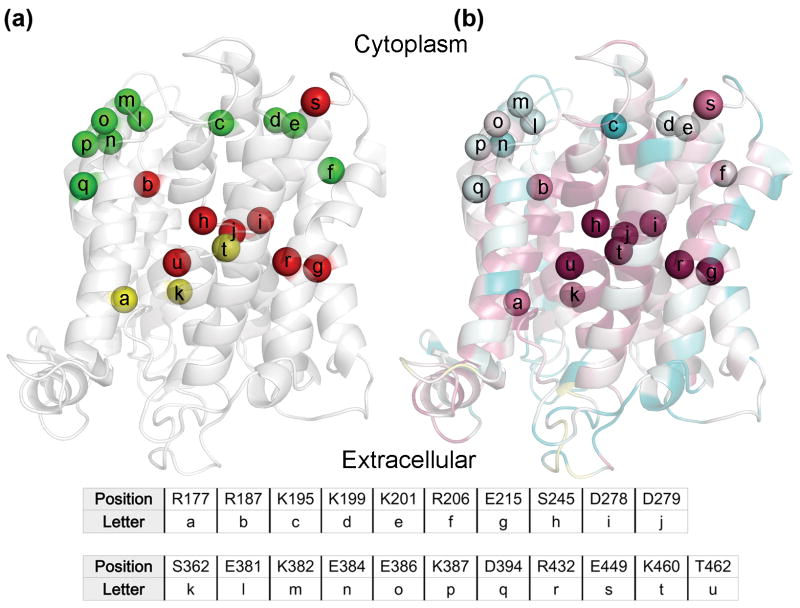
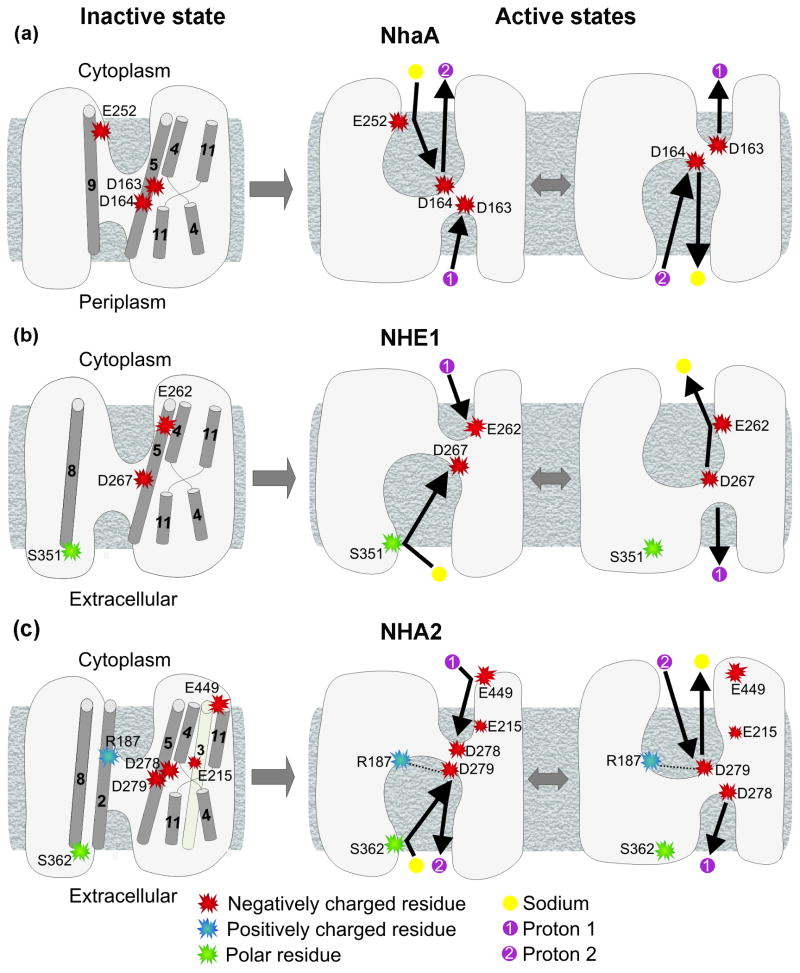
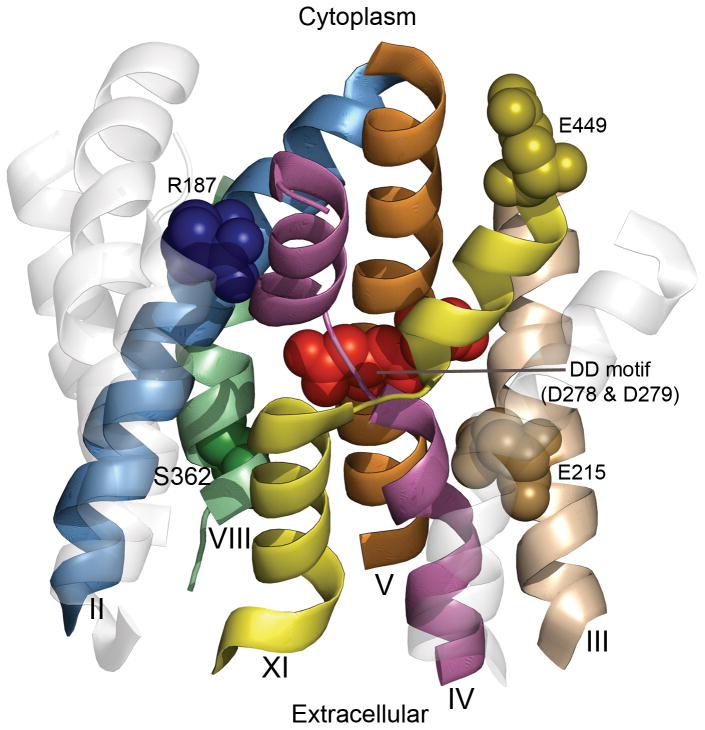
Human NHA2 is a poorly characterized Na(+)/H(+) antiporter recently implicated in essential hypertension. We used a range of computational tools and evolutionary conservation analysis to build and validate a three-dimensional model of NHA2 based on the crystal structure of a distantly related bacterial transporter, NhaA. The model guided mutagenic evaluation of transport function, ion selectivity, and pH dependence of NHA2 by phenotype screening in yeast. We describe a cluster of essential, highly conserved titratable residues located in an assembly region made of two discontinuous helices of inverted topology, each interrupted by an extended chain. Whereas in NhaA, oppositely charged residues compensate for partial dipoles generated within this assembly, in NHA2, polar but uncharged residues suffice. Our findings led to a model for transport mechanism that was compared to the well-known electroneutral NHE1 and electrogenic NhaA subtypes. This study establishes NHA2 as a prototype for the poorly understood, yet ubiquitous, CPA2 antiporter family recently recognized in plants and metazoans and illustrates a structure-driven approach to derive functional information on a newly discovered transporter.
Copyright (c) 2009 Elsevier Ltd. All rights reserved.
Figures
Similar articles
-
Structure, mechanism and lipid-mediated remodeling of the mammalian Na+/H+ exchanger NHA2.Nat Struct Mol Biol. 2022 Feb;29(2):108-120. doi: 10.1038/s41594-022-00738-2. Epub 2022 Feb 16. Nat Struct Mol Biol. 2022. PMID: 35173351 Free PMC article.
-
Dissecting the proton transport pathway in electrogenic Na+/H+ antiporters.Proc Natl Acad Sci U S A. 2017 Feb 14;114(7):E1101-E1110. doi: 10.1073/pnas.1614521114. Epub 2017 Feb 1. Proc Natl Acad Sci U S A. 2017. PMID: 28154142 Free PMC article.
-
A human Na+/H+ antiporter sharing evolutionary origins with bacterial NhaA may be a candidate gene for essential hypertension.Proc Natl Acad Sci U S A. 2007 Nov 20;104(47):18677-81. doi: 10.1073/pnas.0707120104. Epub 2007 Nov 13. Proc Natl Acad Sci U S A. 2007. PMID: 18000046 Free PMC article.
-
Functional role of polar amino acid residues in Na+/H+ exchangers.Biochem J. 2001 Jul 1;357(Pt 1):1-10. doi: 10.1042/0264-6021:3570001. Biochem J. 2001. PMID: 11415429 Free PMC article. Review.
-
NhaA crystal structure: functional-structural insights.J Exp Biol. 2009 Jun;212(Pt 11):1593-603. doi: 10.1242/jeb.026708. J Exp Biol. 2009. PMID: 19448069 Review.
Cited by
-
Molecular aspects of bacterial pH sensing and homeostasis.Nat Rev Microbiol. 2011 May;9(5):330-43. doi: 10.1038/nrmicro2549. Epub 2011 Apr 5. Nat Rev Microbiol. 2011. PMID: 21464825 Free PMC article. Review.
-
Structure, mechanism and lipid-mediated remodeling of the mammalian Na+/H+ exchanger NHA2.Nat Struct Mol Biol. 2022 Feb;29(2):108-120. doi: 10.1038/s41594-022-00738-2. Epub 2022 Feb 16. Nat Struct Mol Biol. 2022. PMID: 35173351 Free PMC article.
-
The Less Well-Known Little Brothers: The SLC9B/NHA Sodium Proton Exchanger Subfamily-Structure, Function, Regulation and Potential Drug-Target Approaches.Front Physiol. 2022 May 25;13:898508. doi: 10.3389/fphys.2022.898508. eCollection 2022. Front Physiol. 2022. PMID: 35694410 Free PMC article. Review.
-
A model-structure of a periplasm-facing state of the NhaA antiporter suggests the molecular underpinnings of pH-induced conformational changes.J Biol Chem. 2012 May 25;287(22):18249-61. doi: 10.1074/jbc.M111.336446. Epub 2012 Mar 19. J Biol Chem. 2012. PMID: 22431724 Free PMC article.
-
Revealing the ligand binding site of NhaA Na+/H+ antiporter and its pH dependence.J Biol Chem. 2012 Nov 2;287(45):38150-7. doi: 10.1074/jbc.M112.391128. Epub 2012 Aug 22. J Biol Chem. 2012. PMID: 22915592 Free PMC article.
References
-
- Orlowski J, Grinstein S. Diversity of the mammalian sodium/proton exchanger SLC9 gene family. Pflugers Arch. 2004;447:549–565. - PubMed
-
- Padan E, Tzubery T, Herz K, Kozachkov L, Rimon A, Galili L. NhaA of Escherichia coli, as a model of a pH-regulated Na+/H+antiporter. Biochim Biophys Acta. 2004;1658:2–13. - PubMed
-
- Counillon L, Pouyssegur J. The expanding family of eucaryotic Na(+)/H(+) exchangers. J Biol Chem. 2000;275:1–4. - PubMed
-
- Brett CL, Donowitz M, Rao R. Evolutionary origins of eukaryotic sodium/proton exchangers. Am J Physiol Cell Physiol. 2005;288:C223–239. - PubMed
Publication types
MeSH terms
Substances
Grants and funding
LinkOut - more resources
Full Text Sources
Medical
Molecular Biology Databases
Miscellaneous
