. 2010 Mar 12;396(5):1227-43.
doi: 10.1016/j.jmb.2009.12.057. Epub 2010 Jan 4.

The effects of CapZ peptide (TRTK-12) binding to S100B-Ca2+ as examined by NMR and X-ray crystallography

Affiliations

The effects of CapZ peptide (TRTK-12) binding to S100B-Ca2+ as examined by NMR and X-ray crystallography

Thomas H Charpentier et al. J Mol Biol. .

Abstract

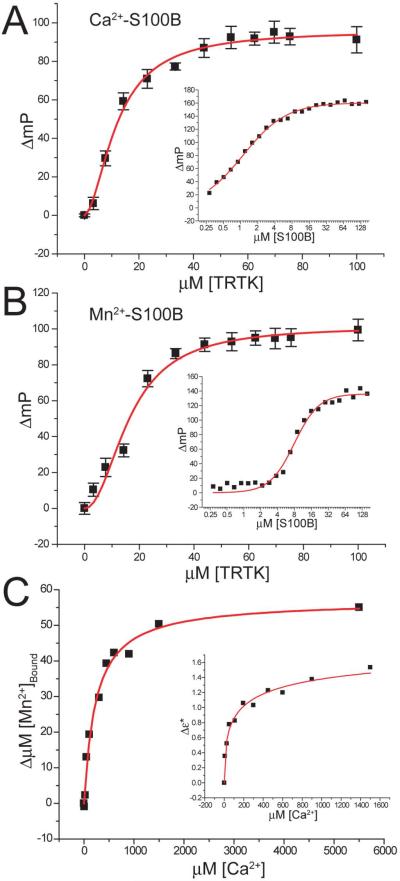
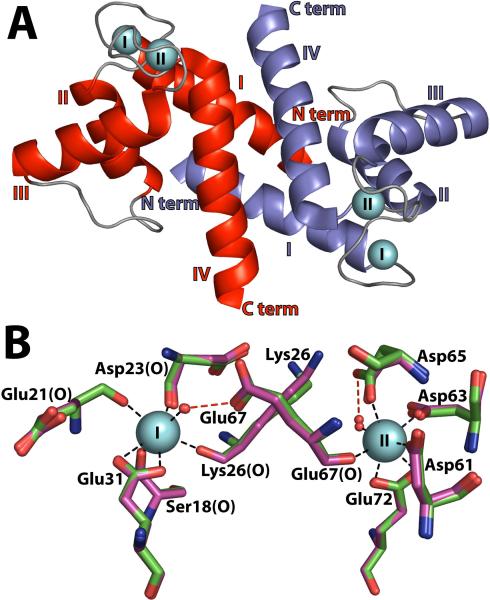
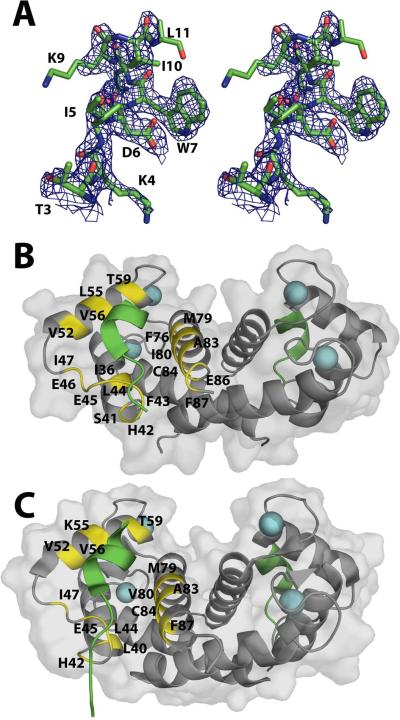
Structure-based drug design is underway to inhibit the S100B-p53 interaction as a strategy for treating malignant melanoma. X-ray crystallography was used here to characterize an interaction between Ca(2)(+)-S100B and TRTK-12, a target that binds to the p53-binding site on S100B. The structures of Ca(2+)-S100B (1.5-A resolution) and S100B-Ca(2)(+)-TRTK-12 (2.0-A resolution) determined here indicate that the S100B-Ca(2+)-TRTK-12 complex is dominated by an interaction between Trp7 of TRTK-12 and a hydrophobic binding pocket exposed on Ca(2+)-S100B involving residues in helices 2 and 3 and loop 2. As with an S100B-Ca(2)(+)-p53 peptide complex, TRTK-12 binding to Ca(2+)-S100B was found to increase the protein's Ca(2)(+)-binding affinity. One explanation for this effect was that peptide binding introduced a structural change that increased the number of Ca(2+) ligands and/or improved the Ca(2+) coordination geometry of S100B. This possibility was ruled out when the structures of S100B-Ca(2+)-TRTK-12 and S100B-Ca(2+) were compared and calcium ion coordination by the protein was found to be nearly identical in both EF-hand calcium-binding domains (RMSD=0.19). On the other hand, B-factors for residues in EF2 of Ca(2+)-S100B were found to be significantly lowered with TRTK-12 bound. This result is consistent with NMR (15)N relaxation studies that showed that TRTK-12 binding eliminated dynamic properties observed in Ca(2+)-S100B. Such a loss of protein motion may also provide an explanation for how calcium-ion-binding affinity is increased upon binding a target. Lastly, it follows that any small-molecule inhibitor bound to Ca(2+)-S100B would also have to cause an increase in calcium-ion-binding affinity to be effective therapeutically inside a cell, so these data need to be considered in future drug design studies involving S100B.


Figures

Figure 1
Figure 1
Thermodynamic binding constants for S100B-metal and S100B-metal-TRTK12 complexes. (a) Displacement of the TAMRA-TRTK12 peptide from the S100B-Ca2+-TAMRA-TRTK12 complex by unlabeled TRTK12 as monitored by fluorescence polarization. The solution contained 1.5 μM S100B, 50 nM TAMRA-TRTK12, and 10 mM CaCl2 in 50mM Tris-HCl pH 7.5. (a, inset) Binding of TAMRA-TRTK12 to S100B-Ca2+ as monitored by fluorescence polarization. The solution contained 50 nM TAMRA-TRTK12, and 10 mM CaCl2 in 50 mM Tris-HCl, pH 7.5. (b) Displacement of the TAMRA-TRTK12 peptide from the S100B-Mn2+-TAMRA-TRTK12 complex by unlabeled TRTK12 as monitored by changes in fluorescence polarization (ΔmP). The solution contained 4 μM S100B, 50 nM TAMRA-TRTK12, and 10 mM MnCl2 in 50mM Tris-HCl pH 7.5. (b, inset) Binding of TAMRA-TRTK12 to S100B-Mn2+ as monitored by changes in fluorescence polarization. The solution contained 50 nM TAMRA-TRTK12, and 10 mM MnCl2 in 50 mM Tris-HCl pH 7.5. (c) Displacement of bound Mn2+ by Ca2+ from S100B in the presence of TRTK as detected by EPR and NMR (inset). The solutions for both experiments contain 65 μM S100B, 150 μM TRTK-12, and 82 μM MnCl2 in 50mM Tris-HCl pH 7.5. The data were fit with the Hill equation to determine Kapp with the corresponding dissociation constants calculated using competition equations described in Material and Methods.
Figure 2
Figure 2
Calcium ion coordination in the X-ray structures of S100B-Ca2+ in the presence and absence of TRTK-12. (a) X-ray crystal structure of S100B-Ca2+ (3IQO) shown in a ribbon diagram with two Ca2+ ions per subunit (cyan spheres) labeled I (EF1, Pseudo EF-hand) and II (EF2, Typical EF-hand) with the subunits of the symmetric S100B homodimer colored red and blue with alpha helices labeled (I–IV). (b) The positions for the sidechains of the Ca2+ coordinating residues are compared for the pseudo-EF-hand (Ser18, Glu21, Asp23, Lys26 and Glu31) and the canonical EF-hand (Asp61, Asp63, Asp65, Glu67, and Glu72) calcium-binding sites of S100B-Ca2+ (green) and S100B-Ca2+-TRTK12 (Magenta) (RMSD = 0.18 Å).
Figure 3
Figure 3
The X-ray and NMR structures of the S100B-Ca2+-TRTK12 complex. (a) Stereo view (walleye mode) of the TRTK-12 peptide when bound to S100B with the electron density maps calculated with the 2mFo-DFc coefficients (1.0σ) for TRTK-12. (b) Ribbon and surface diagram of the X-ray structure of S100B-Ca2+-TRTK12 (3IQQ) illustrating the location of TRTK-12 (green) together with residues of S100B that interact with the peptide (in yellow). (c) Ribbon and surface diagram of the NMR structure of S100B-Ca2+-TRTK12 (1MWN) illustrating the location of TRTK-12 (green) bound to rat S100B with residues colored (in yellow) that have intermolecular NOE correlations to TRTK-12.
Figure 4
Figure 4
Side-chains of S100B and TRTK-12 that are involved in the peptide-protein interface. (a) TRTK-12 peptide residues that are observed in the X-ray crystal structure are illustrated (T3-L11) highlighting residues on S100B that are within 4.0 Å of TRTK peptide (in boxes) and residues that are involved in hydrogen bonding in red. (b) View of TRTK-12 (green) and S100B (blue) illustrating side-chains involved in hydrophobic interactions (yellow) between the TRTK-12 and S100B. (c) View of TRTK-12 (green) and S100B (blue) illustrating side-chains involved in hydrogen bonds (dashed lines) between TRTK-12 and S100B. (d) The X-ray structure of the bovine S100B-Ca2+-TRTK12 complex (shown in blue and green) superposed on the NMR solution structure of the same complex with rat S100B (red PDB: 1MWN).
Figure 5
Figure 5
Changes in main and side-chain positioning for the two asymmetric units of S100B-Ca2+ (model A and B) upon binding TRTK-12. (a) The average RMSDs for the position of main-chain atoms for the two asymmetric units, Model A and Model B, were compared for the X-ray structure of S100B-Ca2+. (b) The average RMSDs for the position of side-chain atoms for the two asymmetric units, Model A and Model B, were compared next for the X-ray structure of S100B-Ca2+. (c) The average RMSDs for the position of main-chain atoms were compared for the X-ray structures of S100B-Ca2+ (model A) and S100B-Ca2+-TRTK12. (d) The average RMSDs for the position of side-chain atoms were compared for the X-ray structures S100B-Ca2+ (model A) and S100B-Ca2+-TRTK. (e) The average RMSDs for the position of main-chain atoms were compared for the X-ray structures of S100B-Ca2+ (model B) and S100B-Ca2+-TRTK12. (f) The average RMSDs for the position of side-chain atoms were compared for the X-ray structures of S100B-Ca2+ (model B) and S100B-Ca2+-TRTK. Those residues that have an average RMSD for main-chain and side-chain value greater than 0.4 and 1.0 Å, respectively, are labeled. Residues of S100B-Ca2+ that are affected by TRTK-12 binding are labeled in red.
Figure 6
Figure 6
Graph showing B-factor values for each residue in S100B-Ca2+ in the absence and presence of bound TRTK-12. (a) Average of main-chain atoms B-factor values per residue of S100B for S100B-Ca2+; model A (blue diamonds), S100B-Ca2+; model B (green squares), S100B-Ca2+-TRTK (red triangle). (inset) Average of main-chain atoms B-factor values per residues of S100B for S100B-Ca2+-pentamidine (orange pluses) and S100B-Ca2+-TRTK (red triangle). (b) Average of all atoms B-factors per residue of S100B for S100B-Ca2+; model A (blue diamonds), Ca2+-S100B; model B (green squares), S100B-Ca2+-TRTK (red triangle). (inset) Average of all atoms B-factors per residue of S100B for S100B-Ca2+-pentamidine (orange pluses) and S100B-Ca2+-TRTK (red triangle). (c) Ribbon diagram of the X-ray structure of S100B-Ca2+-TRTK (3IQQ) illustrating the residues of S100B (in red) that showed significant changes in B-factor values when the X-ray structural models for S100B-Ca2+-TRTK and S100B-Ca2+ (i.e. for both models A and B) were compared.

References

    1. Moore B. A soluble protein characteristic of the nervous system. Biochem. Biophys. Res. Comm. 1965;19:739–744. - PubMed
    1. Donato R. Intracellular and extracellular roles of S100 proteins. Microsc Res Tech. 2003;60:540–51. - PubMed
    1. Heizmann CW. The multifunctional S100 protein family. Methods Mol Biol. 2002;172:69–80. - PubMed
    1. Wilder PT, Lin J, Bair CL, Charpentier TH, Yang D, Liriano M, Varney KM, Lee A, Oppenheim AB, Adhya S, Carrier F, Weber DJ. Recognition of the tumor suppressor protein p53 and other protein targets by the calcium-binding protein S100B. Biochim Biophys Acta. 2006 - PubMed
    1. Santamaria-Kisiel L, Rintala-Dempsey AC, Shaw GS. Calcium-dependent and -independent interactions of the S100 protein family. Biochem J. 2006;396:201–14. - PMC - PubMed

Publication types

MeSH terms