

Characterisation of the BOLD response time course at different levels of the auditory pathway in non-human primates
- PMID: 20053384
- PMCID: PMC2880247
- DOI: 10.1016/j.neuroimage.2009.12.103
Characterisation of the BOLD response time course at different levels of the auditory pathway in non-human primates
Abstract
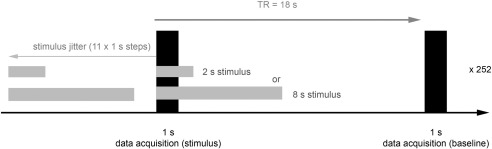
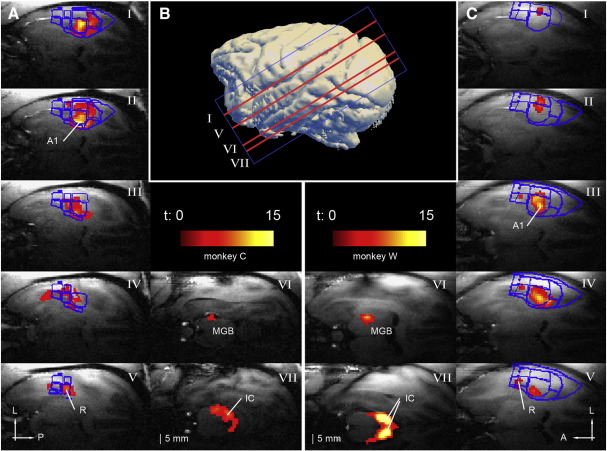
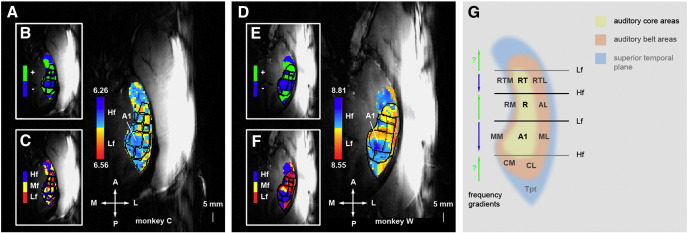
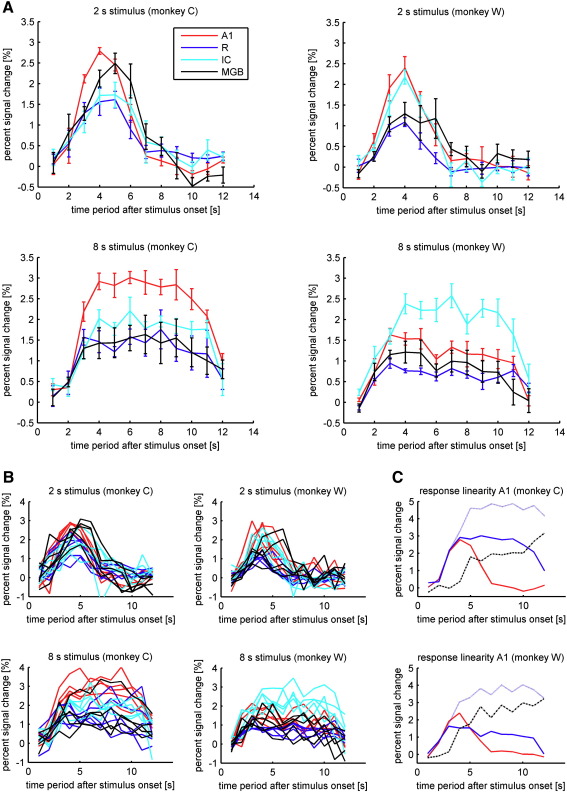
Non-human-primate fMRI is becoming increasingly recognised as the missing link between the widely applied methods of human imaging and intracortical animal electrophysiology. A crucial requirement for the optimal application of this method is the precise knowledge of the time course of the Blood Oxygenation Level Dependent (BOLD) signal. We mapped the BOLD signal time course in the inferior colliculus (IC), medial geniculate body (MGB) and in tonotopically defined fields in the auditory cortex of two macaques. The results show little differences in the BOLD-signal time courses within the auditory pathway. However, we observed systematic differences in the magnitude of the change in the BOLD signal with significantly stronger signal changes in field A1 of the auditory cortex compared to field R. The measured time course of the signal was in good agreement with similar studies in human auditory cortex but showed considerable differences to data reported from macaque visual cortex. Consistent with the studies in humans we measured a peak in the BOLD response around 4 s after the onset of 2-s broadband noise stimuli while previous studies recorded from the primary visual cortex of the same species reported the earliest peaks to short visual stimuli several seconds later. The comparison of our results with previous studies does not support differences in haemodynamic responses within the auditory system between human and non-human primates. Furthermore, the data will aid optimal design of future auditory fMRI studies in non-human primates.
Copyright 2009 Elsevier Inc. All rights reserved.
Figures
Similar articles
-
The association between subcortical and cortical fMRI and lifetime noise exposure in listeners with normal hearing thresholds.Neuroimage. 2020 Jan 1;204:116239. doi: 10.1016/j.neuroimage.2019.116239. Epub 2019 Oct 3. Neuroimage. 2020. PMID: 31586673 Free PMC article.
-
BOLD fMRI investigation of the rat auditory pathway and tonotopic organization.Neuroimage. 2012 Apr 2;60(2):1205-11. doi: 10.1016/j.neuroimage.2012.01.087. Epub 2012 Jan 25. Neuroimage. 2012. PMID: 22297205
-
Auditory midbrain processing is differentially modulated by auditory and visual cortices: An auditory fMRI study.Neuroimage. 2015 Dec;123:22-32. doi: 10.1016/j.neuroimage.2015.08.040. Epub 2015 Aug 22. Neuroimage. 2015. PMID: 26306991
-
Coding of communication calls in the subcortical and cortical structures of the auditory system.Physiol Res. 2008;57 Suppl 3:S149-S159. doi: 10.33549/physiolres.931608. Epub 2008 May 13. Physiol Res. 2008. PMID: 18481905 Review.
-
Subcortical processing in auditory communication.Hear Res. 2015 Oct;328:67-77. doi: 10.1016/j.heares.2015.07.003. Epub 2015 Jul 8. Hear Res. 2015. PMID: 26163900 Review.
Cited by
-
Temporal multivariate pattern analysis (tMVPA): A single trial approach exploring the temporal dynamics of the BOLD signal.J Neurosci Methods. 2018 Oct 1;308:74-87. doi: 10.1016/j.jneumeth.2018.06.029. Epub 2018 Jun 30. J Neurosci Methods. 2018. PMID: 29969602 Free PMC article.
-
Reward cues readily direct monkeys' auditory performance resulting in broad auditory cortex modulation and interaction with sites along cholinergic and dopaminergic pathways.Sci Rep. 2019 Feb 28;9(1):3055. doi: 10.1038/s41598-019-38833-y. Sci Rep. 2019. PMID: 30816142 Free PMC article.
-
Sensitivity to temporal modulation rate and spectral bandwidth in the human auditory system: fMRI evidence.J Neurophysiol. 2012 Apr;107(8):2042-56. doi: 10.1152/jn.00308.2011. Epub 2012 Feb 1. J Neurophysiol. 2012. PMID: 22298830 Free PMC article.
-
The bottom-up information transfer process and top-down attention control underlying tonal working memory.Front Neurosci. 2022 Aug 1;16:935120. doi: 10.3389/fnins.2022.935120. eCollection 2022. Front Neurosci. 2022. PMID: 35979330 Free PMC article.
-
The Representation of Time Windows in Primate Auditory Cortex.Cereb Cortex. 2022 Aug 3;32(16):3568-3580. doi: 10.1093/cercor/bhab434. Cereb Cortex. 2022. PMID: 34875029 Free PMC article.
References
-
- Backes W.H., van Dijk P. Simultaneous sampling of event-related BOLD responses in auditory cortex and brainstem. Magn. Reson. Med. 2002;47:90–96. - PubMed
-
- Belin P., Zatorre R.J., Hoge R., Evans A.C., Pike B. Event-related fMRI of the auditory cortex. NeuroImage. 1999;10:417–429. - PubMed
-
- Birn R.M., Saad Z.S., Bandettini P.A. Spatial heterogeneity of the nonlinear dynamics in the FMRI BOLD response. NeuroImage. 2001;14:817–826. - PubMed
Publication types
MeSH terms
Substances
Grants and funding
LinkOut - more resources
Full Text Sources
Other Literature Sources
Medical
