. 2010 Feb 1;123(Pt 3):340-50.
doi: 10.1242/jcs.039180. Epub 2010 Jan 5.

Pollen-tube tip growth requires a balance of lateral propagation and global inhibition of Rho-family GTPase activity

Affiliations

Pollen-tube tip growth requires a balance of lateral propagation and global inhibition of Rho-family GTPase activity

Jae-Ung Hwang et al. J Cell Sci. .

Abstract

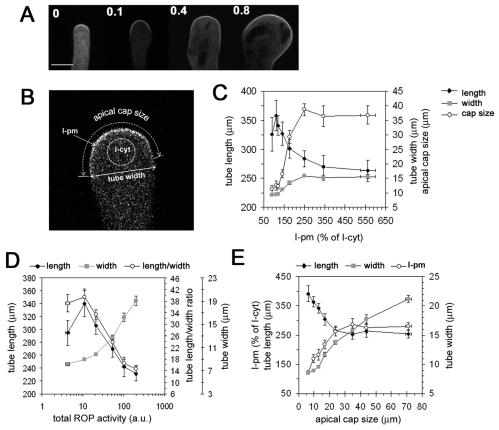
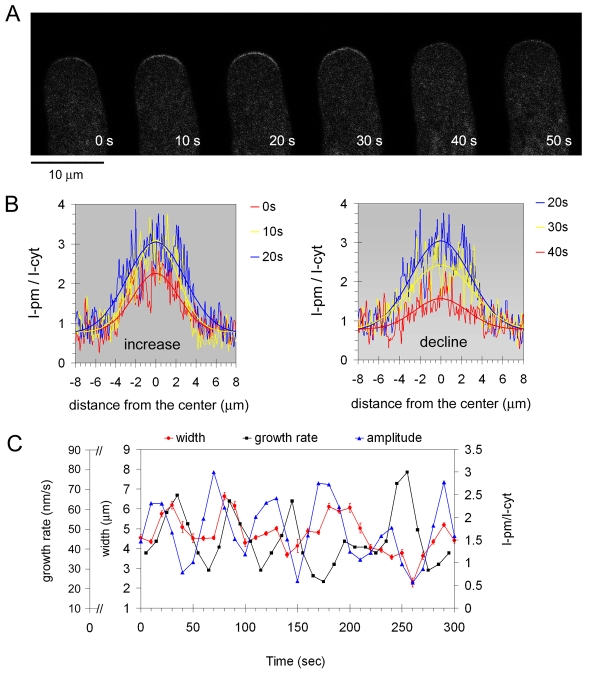
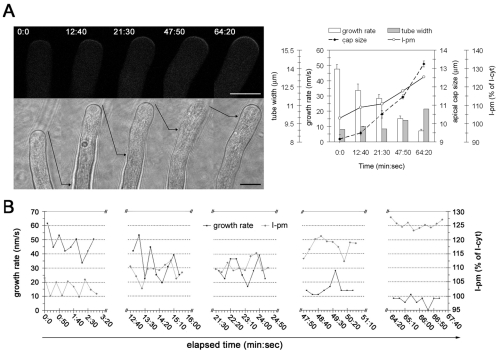
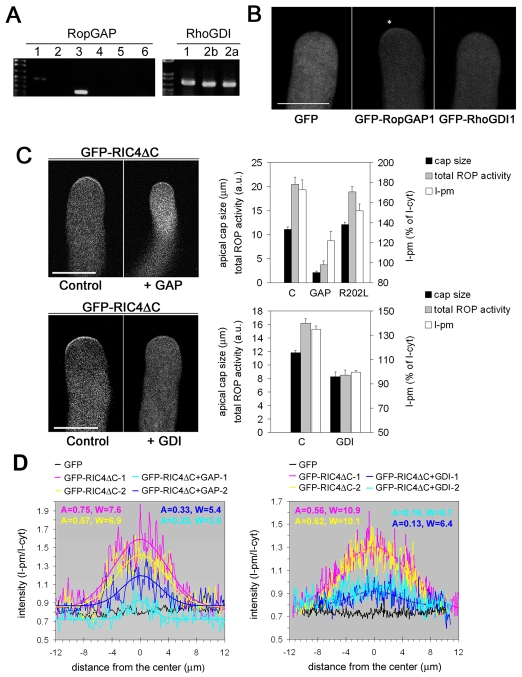
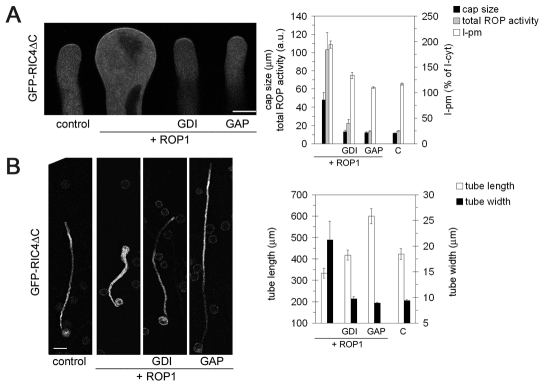
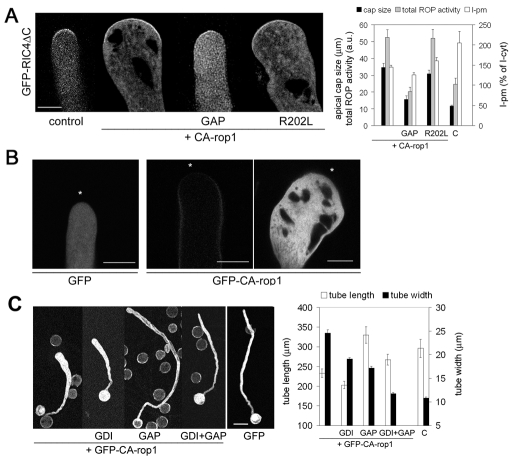
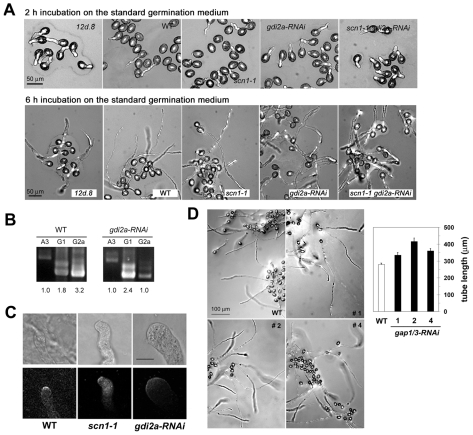
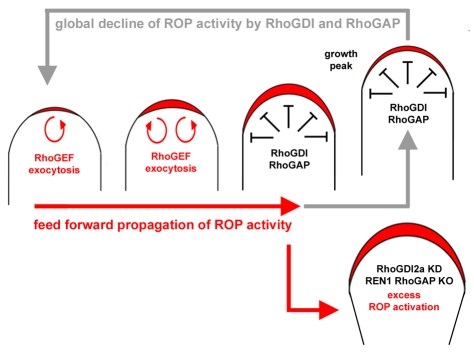
Rapid tip growth allows for efficient development of highly elongated cells (e.g. neuronal axons, fungal hyphae and pollen tubes) and requires an elaborate spatiotemporal regulation of the growing region. Here, we use the pollen tube as a model to investigate the mechanism regulating the growing region. ROPs (Rho-related GTPases from plants) are essential for pollen tip growth and display oscillatory activity changes in the apical plasma membrane (PM). By manipulating the ROP activity level, we showed that the PM distribution of ROP activity as an apical cap determines the tip growth region and that efficient tip growth requires an optimum level of the apical ROP1 activity. Excessive ROP activation induced the enlargement of the tip growth region, causing growth depolarization and reduced tube elongation. Time-lapse analysis suggests that the apical ROP1 cap is generated by lateral propagation of a localized ROP activity. Subcellular localization and gain- and loss-of-function analyses suggest that RhoGDI- and RhoGAP-mediated global inhibition limits the lateral propagation of apical ROP1 activity. We propose that the balance between the lateral propagation and the global inhibition maintains an optimal apical ROP1 cap and generates the apical ROP1 activity oscillation required for efficient pollen-tube elongation.


Figures

Fig. 1.
Fig. 1.
A biphasic relationship between the increase in apical ROP1 activity and pollen-tube growth. To determine how varying levels of the apical ROP1 activity affect pollen-tube growth behavior, different amounts (0-0.8 μg) of the LAT52::ROP1 construct were transiently expressed in tobacco pollen tubes. The apical ROP1 activity was monitored as described in the text from the medial longitudinal confocal images of pollen tubes. The size of the active ROP1 cap and the mean and total ROP1 activity at the tube apical PM were measured. A total of 558 pollen tubes from five independent transformation experiments were analyzed and grouped according to the three features of the apical ROP1 activity, and their relationships with pollen-tube elongation (tube length) and polarity (tube width) were assessed. (A) Representative images of the longitudinal medial section for tubes co-expressing GFP-RIC4ΔC and ROP1. Varying amounts of input ROP1 constructs (0-0.8 μg) are indicated at the top of each tube. Scale bar: 10 μm. (B) A schematic demonstrating how ROP1 activity in the apical cap was quantified. When a pollen tube has a width greater than that of control tubes, it is considered to display growth depolarization. The size of active ROP1 cap was quantified by measuring the distance of the PM region with distinct GFP-RIC4ΔC intensity, as indicated. The mean ROP1 activity was estimated as the mean GFP intensity within the apical cap standardized with the mean cytosol GFP intensity (I-pm in % of I-cyt). The total ROP1 activity in the apical cap was estimated by multiplying I-pm/I-cyt by the cap size. (C) The relationship between pollen-tube growth behavior (tube elongation and growth polarity changes) and the mean ROP1 activity in the apical cap (I-pm). The tubes were grouped according to I-pm (x-axis), of which mean values were plotted against those of pollen-tube length, width, and the size of active ROP1 cap (y axes) (mean values ± s.e.m., n≥50 each data point.). (D) The relationship between pollen-tube growth behavior and the total ROP1 activity in the apical cap. The tubes were grouped according to the total ROP1 activity (x-axis, arbitrary unit, a.u.), which was plotted against pollen-tube length, width, and the length/width ratio (y axes) (mean ± s.e.m., n≥50 each data point.). (E) The size of the active ROP1 cap is linearly correlated with the tube width. Pollen tubes were grouped and analyzed according to the cap size, which was plotted against I-pm, tube length and width (mean ± s.e.m., n≥50 each data point). The Pearson correlation coefficient between 558 pairs of cap size and tube width was 0.80 (significance at P<0.0001), indicating that the active ROP1 cap determines the growing region.
Fig. 2.
Fig. 2.
The apical cap of active ROP1 is generated through localized ROP1 activation followed by its lateral spreading in the pollen-tube apex, whereas global inhibition is involved in the removal of the apical cap. To track spatiotemporal dynamics of the apical ROP1 activity, GFP-RIC4ΔC localization to the tip was time-lapse imaged at 10 second intervals from a pollen tube that grew the oscillatory tip growth. (A) A representative cycle of the apical ROP1 activity oscillation (0-50 seconds). GFP-RIC4ΔC starts to arise from the center of the tube apical PM and propagates rapidly to form the apical cap maximum (0-20 seconds). After reaching the peak, GFP-RIC4ΔC localization in the apical PM decreases (20-40 seconds). The next active ROP1 cap initiates in the center of a previous apical cap (50 s). Numbers indicate time elapsed (seconds) from time 0. (B) Intensity profiles of GFP-RIC4ΔC in the apical cap. GFP-RIC4ΔC intensity (I-pm) was line-scanned from CLSM images in A. Standardized I-pm values with I-cyt are displayed in thin lines according to the distance from the center, and the corresponding Gaussian fit curves are presented in thick lines (Origin 7, y=y0 + (A/(w*sqrt(π/2)))*exp(−2*((x-xc)/w)^2); y, I-pm/I-cyt; x, position in the apical PM; y0, offset; xc, center; yc, y at center; amplitude, yc-y0; w, width at (yc-y0)/2; A, area). The graph on the left shows the intensity profiles during ROP1 activity increase (0-20 seconds), and the graph on the right shows intensity profiles during ROP1 activity decline (20-50 seconds). (C) Oscillation curves of amplitude and width from B, with tip growth rate from the same pollen tube as in A. The peaks of amplitude (maximum ROP1 activity) are ahead of those of width (at half amplitude). A similar temporal lag of an increase in width was observed in four individual pollen tubes with ~60 second period oscillations.
Fig. 3.
Fig. 3.
The gradual enlargement of the size of the active ROP1 cap is accompanied by a dampening of the apical ROP1 activity oscillation, because ROP1 activation dominates ROP1 inhibition. A small amount of ROP1 constructs (50-100 ng) was used to overexpress ROP1 to a moderate level. Over 2.5 hours of bombardment, normally growing transgenic pollen tubes were chosen for time-lapse imaging. (A) Left, representative images showing the apical ROP1 activity (top) and pollen tubes (bottom). Numbers are the elapsed times (minutes:seconds) from the beginning of recording (0:0). At each time point, time-lapse imaging (20 second intervals) was performed for 3 minutes. The net tube elongation between time points is indicated with arrowed lines. Scale bars: 10 μm. Quantitative data of pollen-tube growth and the apical ROP1 activity (mean ± s.e.m.) measured for 3 minutes is shown on the right. The growth rate, I-pm, and the cap size are significantly increased from 12:40, whereas the tube width is apparently wider from time 47:50 (Student's t-test, P<0.05). (B) The oscillations of the apical ROP1 activity (I-pm) and tip growth rate were dampened as the apical ROP1 activity increased. At the beginning (0:0 in A, left), the pollen tube exhibited the normal oscillatory tip growth and apical ROP1 activity (growth rate and I-pm). As the ROP1 activity was apparently amplified by ROP1 overexpression, the apical ROP1 activity (both I-pm and the cap size) progressively increases (A). The increase in the apical ROP1 activity is accompanied by a gradual dampening of tip growth oscillations (B) and tip expansion (A).
Fig. 4.
Fig. 4.
RopGAP1 and RhoGDI1 globally inhibit the apical ROP1 activity in tobacco pollen tubes. Various constructs were transiently expressed in tobacco pollen, and transformed tubes were analyzed. C, control; GAP, RopGAP1; R202L, RopGAP1(R202L); GDI, RhoGDI1. (A) RT-PCR analysis detected the transcripts of RopGAP1, RopGAP3, RhoGDI1, RhoGDI2a and RhoGDI2b in Arabidopsis pollen. No transcripts for RopGAP4, 5, and 6 were detected in the assay. Pollen RNA was isolated, and RT-PCR was performed. 40 and 35 cycles of amplifications (94°C for 30 seconds, 58°C for 30 seconds, and 72°C for 1 minute) were performed for RopGAPs (GAP) and RhoGDIs (GDI), respectively. (B) Representative localization patterns of GFP-RopGAP1 and GFP-RhoGDI1. GFP-RopGAP1 is localized both in the cytosol and the tube apical PM (asterisk). GFP-RhoGDI1 localizes only in the cytosol. Scale bar: 10 μm. (C) Both RopGAP1 and RhoGDI1 globally inhibit the apical ROP1 activity. Overexpression of either RopGAP1 (top panels) or RhoGDI1 (bottom panels) significantly reduced the total ROP1 activity in the tube apex, which results in the reduction in both the average ROP1 activity (I-pm) and the size of apical ROP1 cap (cap size). Left panels show representative images of GFP-RIC4ΔC localization. Right panels show quantitative data from three independent experiments (mean ± s.e.m., n>60 each, P<0.01). In both RopGAP1 and RhoGDI1 cases, reduction in the amount and the cap size of the apical ROP1 activity (see left panels) was associated with a global decrease in GFP-RIC4ΔC intensity in the tube apical PM. In about 50% of RopGAP1-overxpressing tubes, distinct GFP-RIC4ΔC localization to the PM was lost. In these tubes, the cap size was considered to be zero, accounting for the unusually small mean size of the apical ROP1 cap. RopGAP1(R202L) reduced the I-pm slightly, which might result from its CRIB motif competing with RIC4ΔC for active ROP1 interaction. However, the effects of RopGAP1 on the cap size and I-pm were significantly different from those of RopGAP1(R202L) (P<0.05). Scale bars: 10 μm. (D) Representative GFP-RIC4ΔC intensity profiles in the apical cap from RopGAP1 (GAP in left panel) or RhoGDI1 (GDI in right panel) expressing pollen tubes in comparison with control tubes (GFP-RIC4ΔC alone or free GFP). As in Fig. 2, GFP-RIC4ΔC intensity (I-pm) was line-scanned from CLSM images and ratios of I-pm/I-cyt are displayed according to the distance from the center, and corresponding Gaussian fit curves are presented. A, amplitude; W, width.
Fig. 5.
Fig. 5.
GAP and GDI suppress the lateral propagation of the apical ROP1 activity. Various constructs were transiently expressed in tobacco pollen, and transformed tubes were analyzed. Control (C), GFP-RIC4ΔC alone or GFP alone; GAP, RopGAP1; GDI, RhoGDI1. (A) RopGAP1 and RhoGDI1 co-expression suppressed the enlargement of the apical ROP1 cap induced by ROP1 overexpression. Left, representative images showing tip-localized GFP-RIC4ΔC. Scale bar: 10 μm. Right, quantitative data (mean ± s.e.m., n>30, each). RhoGDI and RopGAP significantly inhibited the increases in I-pm, cap size, and total ROP activity induced by ROP1 overexpression (P<1.0×10⁻⁴). Similar results were obtained in three independent experiments. (B) Coexpression of RopGAP1 or RhoGDI1 suppressed the growth depolarization induced by ROP1 overexpression (P<0.005). Left, representative pollen-tube images. Scale bar: 50 μm. Right, quantitative data (mean ± s.e.m., n>30, each). Similar results were obtained in three independent experiments.
Fig. 6.
Fig. 6.
CA-rop1 induces the enlargement of the active ROP1 cap and growth depolarization by promoting the activation of endogenous ROP1. Different constructs were transiently expressed in tobacco pollen. Control (C), expressing GFP-RIC4ΔC alone; GAP, RopGAP1; R202L, RopGAP1(R202L). (A) CA-rop1-induced enlargement of the active ROP1 cap is suppressed by RopGAP1. The apical ROP1 activity was visualized with GFP-RIC4ΔC in tubes expressing CA-rop1 alone or co-expressing CA-rop1 and RopGAP1 or RopGAP1(R202L). CA-rop1 dramatically increased the total apical ROP1 activity and the size of the active ROP1 cap, and this increase was suppressed by RopGAP1 coexpression (P<0.005), but not by RopGAP1(R202L) coexpression. Left, representative images showing GFP-RIC4ΔC localization. Scale bar: 10 μm. Right, quantitative data (mean ± s.e.m., n≥30, each). Similar results were obtained in three independent experiments. CA-rop1 tended to induce a lower I-pm than that in control tubes, probably because of the accumulation of CA-rop1 in the cytosol, which could reduce the pool of GFP-RIC4ΔC available for the PM-localized active ROP1. (B) Representative images showing the localization of GFP-CA-rop1 in pollen tubes. In the majority of pollen tubes, GFP-CA-rop1 was found in the cytosol and a small amount was associated with the PM (right). The PM association is clearly seen only in pollen tubes with a low level of GFP-CA-rop1 expression (center). Unlike that of WT-ROP1 (Li et al., 1999; supplementary material Fig. S3), the PM association of GFP-CA-rop1 did not preferentially occur at the PM apex, but rather evenly in the whole PM (22% of cells observed) or preferentially in the PM regions flanking the apex (45%). The images were taken focused on the pollen-tube apex (asterisk). Scale bar: 10 μm. (C) Co-expression of RopGAP1 effectively suppressed growth depolarization induced by GFP-CA-rop1. Left, representative pollen-tube images. Scale bar, 50 μm. Right, quantitative data (mean ± s.e.m., n>30, each). RopGAP1 coexpression with GFP-CA-rop1 substantially promoted tube elongation (P<5×10⁻⁴) and suppressed growth depolarization (P<5×10⁻¹²). Similar results were observed in three independent experiments.
Fig. 7.
Fig. 7.
Role of RhoGDIs and RopGAPs in the control of ROP1 activation in the pollen-tube apex in Arabidopsis. (A) Loss of RhoGDI2a function (gdi2a-RNAi) caused growth depolarization as did GFP-ROP1 overexpression, whereas LOF of RhoGDI1 (scn1-1) resulted in slightly wavy pollen-tube growth. Representative pollen-tube images of GFP-ROP1ox (12d.8), WT, scn1-1, gdi2a-RNAi and scn1-1 gdi2a-RNAi (top, 2 hours and bottom, 6 hours). (B) Pollen RT-PCR analysis of RhoGDI2a transcript level (G2a) in gdi2a-RNAi pollen in comparison with that of WT pollen. Actin3 (A3) and RhoGDI1 (G1) are used as an internal control. Numbers at the bottom indicate relative band intensities compared with that of Actin3. (C) Localization of endogenous ROP was depolarized in gdi2a-RNAi pollen tubes. Representative images showing endogenous ROP localization to Arabidopsis pollen-tube apex, which was visualized with anti-ROP antibody. Scale bar: 10 μm. (D) Knockdown of RopGAP1 and RopGAP3 might promote pollen-tube growth, but does not affect growth polarity. Left, representative images of WT or three independent gap1/3-RNAi pollen tubes cultured on the germination medium containing 0.5 mM Ca2+ for 8-9 hours. Right, quantitative result of gap1/3-RNAi pollen-tube growth compared with that of WT (mean ± s.e.m.). The pollen-tube length of gap1/3-RNAi lines was longer than that of WT tubes (n≥100 each, P<0.001).
Fig. 8.
Fig. 8.
A model for the generation and maintenance of the apical cap of active ROP1 in growing pollen tubes. The localized ROP1 activity in the center of tube apical PM is amplified through a positive-feedback loop of ROP1 activation, such as recruitment of RhoGEF or other upstream ROP activator, which induces a rapid increase of local ROP1 activity and then its lateral propagation through the apex, generating the active ROP1 cap. The plasma membrane flow driven by active ROP1-mediated exocytosis might also contribute to the rapid lateral propagation of ROP1 activity by facilitating the diffusion of ROP1 and its regulators in the PM. RhoGAP and RhoGDI globally inhibit ROP1 in the apex, preventing excess lateral propagation and finally terminating one cycle of ROP1 activity increase. ROP1 activity starts to increase again, probably via positive feedback from the remnant of the previous active ROP1 cap. A tightly balanced interaction of ROP1 activation and inactivation might continuously generate the dynamic apical ROP1 activity for the continuous tip growth. When the balance is broken by loss of critical RhoGDI or RhoGAP activity (RhoGDI2a and REN1 RhoGAP in Arabidopsis pollen tube), ROP1 becomes activated, resulting in the depolarization of apical ROP1 cap and pollen-tube tip growth.

Similar articles

Cited by

References

    1. Alberts P., Rudge R., Irinopoulou T., Danglot L., Gauthier-Rouviere C., Galli T. (2006). Cdc42 and actin control polarized expression of TI-VAMP vesicles to neuronal growth cones and their fusion with the plasma membrane. Mol. Biol. Cell 17, 1194-1203 - PMC - PubMed
    1. Alonso J. M., Stepanova A. N., Leisse T. J., Kim C. J., Chen H., Shinn P., Stevenson D. K., Zimmerman J., Barajas P., Cheuk R., et al. (2003). Genome-wide insertional mutagenesis of Arabidopsis thaliana. Science 301, 653-657 - PubMed
    1. Bischoff F., Vahlkamp L., Molendijk A., Palme K. (2000). Localization of AtROP4 and AtROP6 and interaction with the guanine nucleotide dissociation inhibitor AtRhoGDI1 from Arabidopsis. Plant Mol. Biol. 42, 515-530 - PubMed
    1. Bove J., Vaillancourt B., Kroeger J., Hepler P. K., Wiseman P. W., Geitmann A. (2008). Magnitude and direction of vesicle dynamics in growing pollen tubes using spatiotemporal image correlation spectroscopy and fluorescence recovery after photobleaching. Plant Physiol. 147, 1646-1658 - PMC - PubMed
    1. Bushart T. J., Roux S. J. (2006). Conserved features of germination and polarized cell growth: a few insights from a pollen-fern spore comparison. Ann Bot. (Lond.) 99, 9-17 - PMC - PubMed

Publication types

MeSH terms