. 2010 Apr 1;19(7):1174-89.
doi: 10.1093/hmg/ddp588. Epub 2010 Jan 6.

Pkd1 transgenic mice: adult model of polycystic kidney disease with extrarenal and renal phenotypes

Affiliations

Pkd1 transgenic mice: adult model of polycystic kidney disease with extrarenal and renal phenotypes

Almira Kurbegovic et al. Hum Mol Genet. .

Abstract

While high levels of Pkd1 expression are detected in tissues of patients with autosomal dominant polycystic kidney disease (ADPKD), it is unclear whether enhanced expression could be a pathogenetic mechanism for this systemic disorder. Three transgenic mouse lines were generated from a Pkd1-BAC modified by introducing a silent tag via homologous recombination to target a sustained wild-type genomic Pkd1 expression within the native tissue and temporal regulation. These mice specifically overexpressed the Pkd1 transgene in extrarenal and renal tissues from approximately 2- to 15-fold over Pkd1 endogenous levels in a copy-dependent manner. All transgenic mice reproducibly developed tubular and glomerular cysts leading to renal insufficiency. Interestingly, Pkd1(TAG) mice also exhibited renal fibrosis and calcium deposits in papilla reminiscent of nephrolithiasis as frequently observed in ADPKD. Similar to human ADPKD, these mice consistently displayed hepatic fibrosis and approximately 15% intrahepatic cysts of the bile ducts affecting females preferentially. Moreover, a significant proportion of mice developed cardiac anomalies with severe left-ventricular hypertrophy, marked aortic arch distention and/or valvular stenosis and calcification that had profound functional impact. Of significance, Pkd1(TAG) mice displayed occasional cerebral lesions with evidence of ruptured and unruptured cerebral aneurysms. This Pkd1(TAG) mouse model demonstrates that overexpression of wild-type Pkd1 can trigger the typical adult renal and extrarenal phenotypes resembling human ADPKD.


Figures

Figure 1.
Figure 1.
Genomic analysis of Pkd1TAG transgenic mice. Representative analysis of the 5′ regulatory region of Pkd1TAG transgenic mice was carried out based on a polymorphism at ∼4.5 kb upstream of the translation initiation codon of the murine Pkd1 gene. Since Pkd1TAG transgenic mice were produced on a mixed C57Bl6/J and CBA/J inbred background, the BAC of 129sv origin could be detected by 100 bp amplification band, whereas the C57Bl6/J and CBA/J displayed a 133 and 113 bp, respectively. Analysis of the 3′ Pkd1TAG region was verified on Southern using a KpnI digestion with the Pkd1 ‘g’ probe (exon 45–46). Bands are expected at 7 kb for the endogenous Pkd1 gene and at 5 kb for the Pkd1TAG transgene (5 kb). The 5′ and the 3′ ends of the transgene were intact for the three transgenic mouse lines. M, 100 bp marker; C, negative control; C57, C57Bl/6J mice; CBA, CBA/J mice; 129, 129sv mice; Ma, lambda HindIII marker; WT, wild-type control mice; Tg, Pkd1TAG transgene; Endo, endogenous Pkd1 gene; E, EcoRI; K, Kpnl; E*, tag silent point mutation.
Figure 2.
Figure 2.
Expression analysis of Pkd1TAG transgenic mice. (A) Renal expression analysis of total Pkd1 (endogenous and transgene: ∼14.2 kb) transcript of Pkd1TAG transgenic mice assessed by northern blotting using Pkd1 probe ‘f’ (exon 36–45) and Gapdh (1.2 kb). One representative kidney sample from each transgenic line 6, 18 and 26 is compared with endogenous Pkd1 transcript of control (C) genetic background and age-matched mice. Quantification of renal transcripts from transgenic Pkd1TAG mouse lines were increased compared with endogenous Pkd1 transcript as indicated below the blot (control refers to 1). (B) Quantitative real-time PCR of Pkd1 expression from renal and extrarenal tissues was carried out using primers in exons 1 and 2. Transgenic mice (n = 3; *n = 2) from each of the three different lines and non-transgenic age-matched control mice (4–12 mo) were analyzed in triplicata for Pkd1 and S16 that served as an internal control. Quantification of renal expression in these transgenic mice ranged from 1.3- to 15.5-fold relative to endogenous levels of control mice arbitrarily set at 1. Extrarenal tissue expression levels were established in function of Pkd1 levels in control kidneys. Number in parentheses refers to the ratio of transgene expression levels to the organ control. Similar gene expression ratio or fold-increase was detected for each transgenic line across the tissues analyzed. (C) Renal and extrarenal polycystin-1 protein expression analysis in Pkd1TAG26 mice (6 mo) by western blot using the N-terminal Pc-1 7e12 antibody. In Pkd1TAG organs, Pc-1 expression was intact and at higher expression levels than controls (6 mo). Of the organs tested, highest Pc-1 signal was detected in lungs, heart and kidney. Quantities of protein loaded (40 or 80 µg prot) are indicated below the blot. C, non-transgenic control mice; Tg, Pkd1TAG transgenic mice, line 26. Gapdh was used as an internal loading control.
Figure 3.
Figure 3.
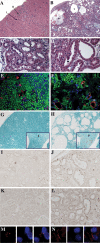
Renal phenotype in Pkd1TAG mice. (A and B) Overview of renal cortical sections from adult 20-month-old control and Pkd1TAG6 mice, respectively. While control exhibited normal glomeruli (g) and tubule (t), Pkd1TAG6 mice showed presence of numerous glomerular and tubular cysts associated with frequent proteinaceous casts (pc) and of tubulointerstitial fibrosis (H&E). Original magnification, ×10. (C and D) High power view of renal sections of Pkd1TAG6 and 26 mice (26 and 16 mo) that show epithelial hyperplasia and hypertrophy (H) as well as presence of polyps (arrowhead) in cystic tubules. Original magnification, ×40. (E and F) Assessment of nephron segment origin in control and Pkd1TAG26 mice (7 mo), respectively, was determined by immunofluorescence using specific markers of proximal (Lotus tetragonolobus, green), distal (Esculentum lycopersicon, blue) and collecting ducts (α-calbindin D28K, red). Transgenic mice displayed cysts from all nephron segments and in higher proportion in proximal and collecting tubules. Noticeably, epithelial hyperplasia and hypertrophy (H) were frequently observed in dilated collecting ducts. Original magnification, ×20. (G and H) Analysis of calcium deposits from renal sections of control and Pkd1TAG26 (10 mo), respectively, was evaluated by Alizarin red staining. Intense extracellular calcium deposits were detected in the renal papilla of Pkd1TAG26 mice (inset) but absence of signal in cysts or in kidneys of non-transgenic mice. Original magnification, ×10. (I and J) Proliferation was assessed from control and Pkd1TAG26 renal sections (13 mo), respectively, with the Ki67 nuclear proliferation marker. Epithelial cells from normal and dilated tubules displayed higher rate of proliferation in Pkd1TAG26 mice compared with control. Original magnification, ×40. (K and L) Detection of c-myc in renal tissues of control and Pkd1TAG6 (13 mo), respectively, correlated with higher proliferation rate. Increased nuclear and even cytoplasmic staining in cystic and non-cystic regions in Pkd1TAG6 relative to control. Original magnification, ×40. (M and N) Primary cilia of renal epithelial cells from control and Pkd1TAG mice (1 mo), respectively, were assessed. Triplet figure consists of staining by α-acetylated tubulin (left panel) marker for cilia, DAPI (middle panel) for nucleus and merge (right panel). In control mice, the average length of cilia was estimated to 2–3 µm, whereas in Pkd1TAG26 mice a significant shift in cilia length distribution to longer cilia of ≥5 µm was measured. Original magnification, ×100.
Figure 4.
Figure 4.
Analysis of urinary proteins in Pkd1TAG mice. (A) Protein urine samples from all Pkd1TAG mouse lines (4 mo) were compared with non-transgenic age-matched control (C) and SBM transgenic mice (positive control that develop PKD) in addition to serum protein sample (S) from non-transgenic mice on SDS–PAGE stained by Coomassie blue. Albumin normally present in serum was detected at abnormally high levels in Pkd1TAG26 urine comparable to SBM urine. Pkd1TAG mice like SBM mice exhibit non-selective proteinuria. Mice also displayed normal excretion of the major urinary proteins (MUPs). M: molecular mass markers of 31–200 kDa. (B) Polycystin-1 was analyzed in fractioned urinary samples by western blot using the N-terminal 7e12 Pc-1 antibody. Two bands (slightly above ∼420 kDa and ∼360–380 kDa) were typically detected in native (N, without treatment) samples whether from total kidney protein extracts of Pkd1TAG26, from total urinary proteins (T) or exosome-free fraction (S1) of Pkd1TAG26 and of control mice (mean ∼9 mo). A unique Pc-1 band slightly above ∼420 kDa was observed in exosome (Exo) fractions from Pkd1TAG and control urine, whereas the uromodulin-positive (S2) fraction appears devoided of Pc-1. Noticeably, Pkd1TAG transgenic mice in comparison to age-matched control mice consistently showed more intense Pc-1 bands and likely higher Pc-1 excretion. Upon deglycosylation (DG) of protein extracts with PNGase, a unique band is detected at the size of the lowest native band (∼360–380 kDa), showing strong glycosylation of Pc-1 and indicating that the band above ∼420 kDa is likely the cleaved form of Pc-1 (predicted mass of 448 and 328 kDa glycosylated and deglycosylated, respectively).
Figure 5.
Figure 5.
Pkd1TAG mice hepatic phenotypes. (A and B) Macroscopic view of livers is shown from adult control and Pkd1TAG26 mice (20 mo), respectively. In comparison with normal liver of control mice, liver of Pkd1TAG mice appeared abnormal with clusters of cysts. Original magnification, ×5. (C and D) Overview of liver histologic sections from adult control and Pkd1TAG26 mice (14 and 23 mo), respectively. Notably, a Pkd1TAG mouse shows presence of numerous cysts (c) lined by cuboid epithelium, suggesting tubular cholangiocyte origin. Cluster of cysts are formed focally around the periportal region tubular structures (H&E). Original magnification, ×10. (E and F) Liver sections from adult control and Pkd1TAG26 mice (11 and 14 mo), respectively. Liver of Pkd1TAG mice displayed severe periportal fibrosis with various levels of increased interstitial fibrosis (Sirius red). Original magnification, ×10. (G and H) Proliferation was assessed from liver sections of control and Pkd1TAG26 (21 mo), respectively with the Ki67 nuclear proliferation marker. Cystic epithelium of the liver was associated with higher rate of proliferation compared to non-cystic control. Original magnification, ×40. (I and J) Analysis of c-myc in hepatic tissues of control and Pkd1TAG26 (16 and 23 mo), respectively, correlated with higher proliferation rate. Increased nuclear and even cytoplasmic staining is observed in cystic regions in Pkd1TAG relative to control. Original magnification, ×40.
Figure 6.
Figure 6.
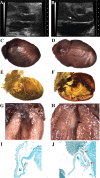
Cardiac phenotypes in Pkd1TAG mice. (A and B) Non-invasive ultrasound of cardiac function of adult control mice and Pkd1TAG26 mice (16 mo), respectively. Echocardiography of Pkd1TAG mice detected presence of hyperechoic aortic valve indicating calcification and probably stenosis (white arrow). Attached video imaging shows the inability of the aortic valves to fully open. (C and D) Anatomy of hearts from adult control mice and Pkd1TAG mice (8 and 7 mo), respectively. The heart size of Pkd1TAG mice (0.32 g and body weight 16.7 g) is readily larger than non-transgenic control (0.27 g and body weight 31.5 g). Original magnification, ×2.5. (E and F) Heart vasculature from adult control mice and Pkd1TAG26 mice (11 and 13 mo), respectively, filled with Microfil latex. Pkd1TAG mouse left ventricle hypertrophy was clearly visible under 3D angles by different segmentation and the substantial decreased vascularization of ventricular wall (asterisk). (G and H) Longitudinally sectioned heart from adult control and Pkd1TAG mice (11 and 12 mo), respectively. View of sectioned heart of Pkd1TAG26 mouse displays changes in color pigmentation of the left ventricle wall (arrow) due to calcium deposits as defined with specific histology stains. Original magnification, ×5. (I and J) Higher power view of aortic valves from adult control and Pkd1TAG mice (11 and 12 mo), respectively. Pkd1TAG mouse exhibited severe calcified valves (arrow) stained with Alizarin red consistent with echocardiography. Original magnification, ×20.
Figure 7.
Figure 7.
Pkd1TAG mice vascular defect: intracranial aneurysm. (A and B) Macroscopic view of scalped head is shown from adult control and Pkd1TAG26 mice (1 mo), respectively. Evidence of enlarged skull associated with abnormal brain/ventricle morphology, sagital suture, intracranial hemorrhages and edema in Pkd1TAG mice. (C and D) Overview of brain sections from adult control and Pkd1TAG mice (1 mo), respectively. Evidence of Pkd1TAG cortex (c) thinning is shown with a major cavity associated with elongated and compressed cerebellum (ce) due to hemorrhage and excessive fluid (H&E). Original magnification, ×1.25. (E and F) Brain vasculature from adult control mice and Pkd1TAG26 mice (11 and 13 mo), respectively, filled with Microfil latex. Evidence of unruptured cerebral aneurysm (arrow) was observed in a Pkd1TAG mouse, whereas not detected in vasculature of control mice. Original magnification, ×5.

Similar articles

Cited by

References

    1. Chapman A.B., Rubinstein M.D., Hughes R., Stears J.C., Earnest M.P., Johnson A.M., Gabow P.A., Kaehny W.D. Intracranial aneurysms in autosomal dominant polycystic kidney disease. N. Engl. J. Med. 1992;327:916–920. - PubMed
    1. Wei W., Hackmann K., Xu H., Germino G., Qian F. Characterization of cis-autoproteolysis of polycystin-1, the product of human polycystic kidney disease 1 gene. J. Biol. Chem. 2007;282:21729–21737. - PubMed
    1. Ward C.J., Turley H., Ong A.C.M., Comley M., Biddolph S., Chetty R., Ratcliffe P.J., Gatter K., Harris P.C. Polycystin, the polycystic kidney disease 1 protein, is expressed by epithelial cells in fetal, adult and polycystic kidney. Proc. Natl Acad. Sci. USA. 1996;93:1524–1528. - PMC - PubMed
    1. Ong A.C.M., Ward C.J., Butler R.J., Biddolph S., Bowker C., Torra R., Pei Y., Harris P.C. Coordinate expression of the autosomal dominant polycystic kidney disease proteins, polycystin-2 and polycystin-1, in normal and cystic tissue. Am. J. Pathol. 1999;154:1721–1729. - PMC - PubMed
    1. Geng L., Segal Y., Peissel B., Deng N., Pei Y., Carone F., Rennke H.G., Glücksmann-Kuis A.M., Schneider M.C., Ericsson M., et al. Identification and localization of polycystin, the PKD1 gene product. J. Clin. Invest. 1996;98:2674–2682. - PMC - PubMed

Publication types

Substances