. 2010 Apr 1;19(7):1199-210.
doi: 10.1093/hmg/ddp590. Epub 2010 Jan 6.

Gain-of-function mutation in FGFR3 in mice leads to decreased bone mass by affecting both osteoblastogenesis and osteoclastogenesis

Affiliations

Gain-of-function mutation in FGFR3 in mice leads to decreased bone mass by affecting both osteoblastogenesis and osteoclastogenesis

Nan Su et al. Hum Mol Genet. .

Abstract

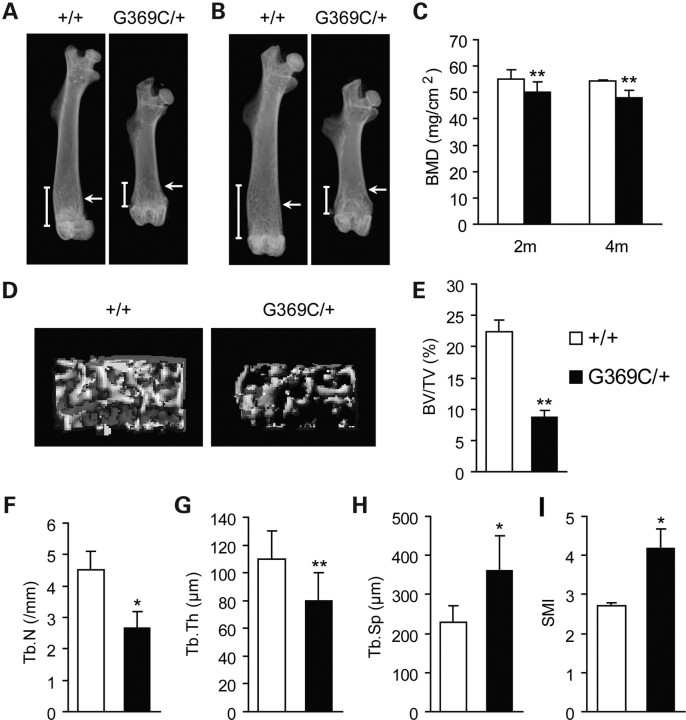
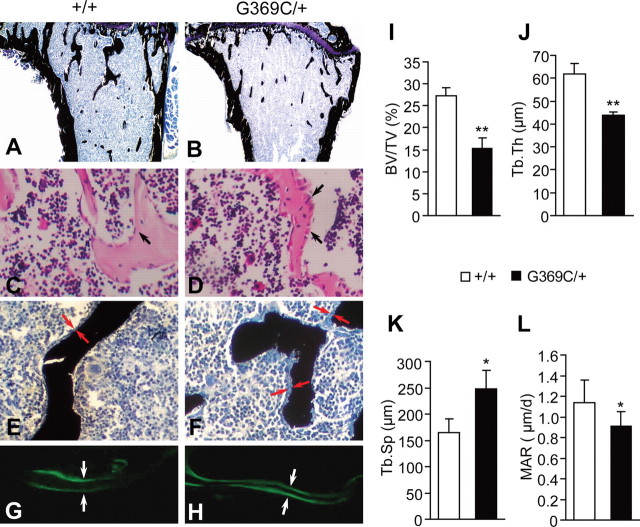
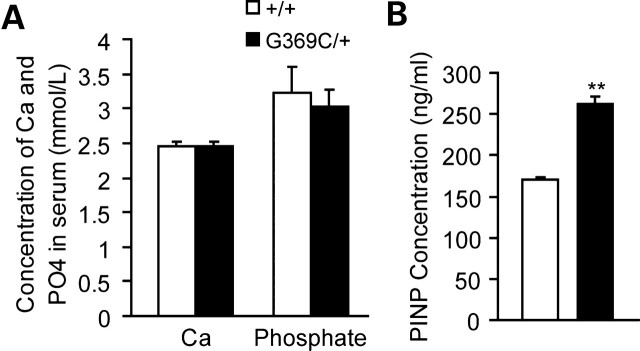
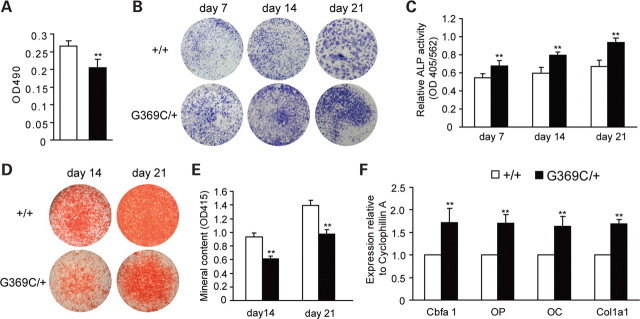
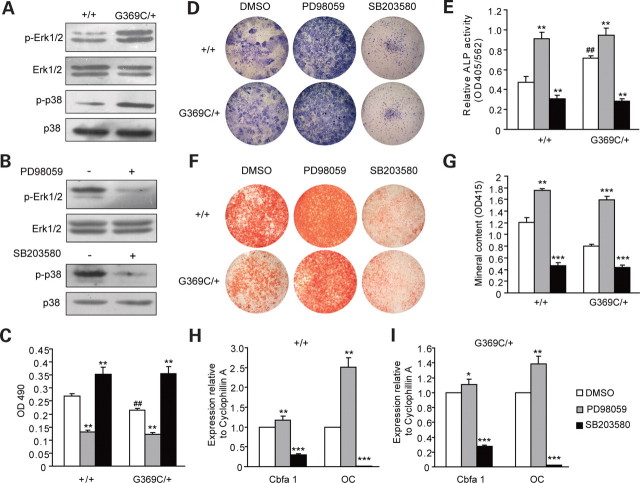
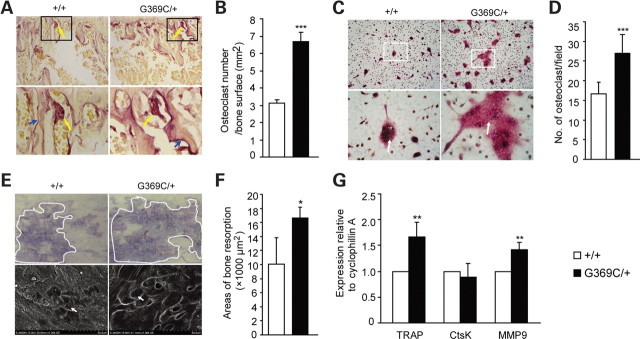
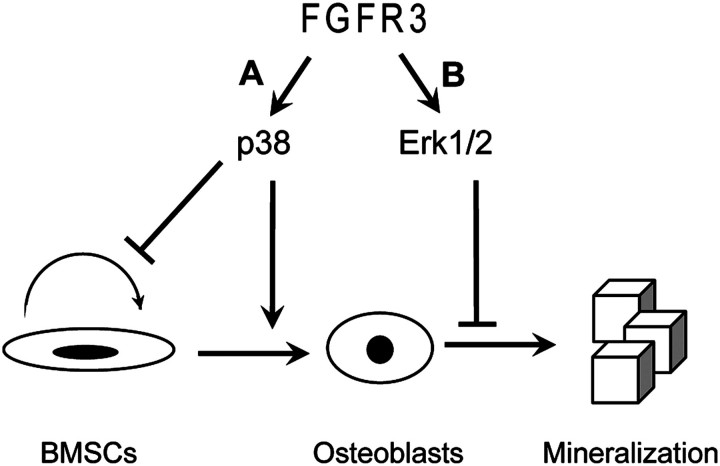
Achondroplasia (ACH) is a short-limbed dwarfism resulting from gain-of-function mutations in fibroblast growth factor receptor 3 (FGFR3). Previous studies have shown that ACH patients have impaired chondrogenesis, but the effects of FGFR3 on bone formation and bone remodeling at adult stages of ACH have not been fully investigated. Using micro-computed tomography and histomorphometric analyses, we found that 2-month-old Fgfr3(G369C/+) mice (mouse model mimicking human ACH) showed decreased bone mass due to reduced trabecular bone volume and bone mineral density, defect in bone mineralization and increased osteoclast numbers and activity. Compared with primary cultures of bone marrow stromal cells (BMSCs) from wild-type mice, Fgfr3(G369C/+) cultures showed decreased cell proliferation, increased osteogenic differentiation including up-regulation of alkaline phosphatase activity and expressions of osteoblast marker genes, and reduced bone matrix mineralization. Furthermore, our studies also suggest that decreased cell proliferation and enhanced osteogenic differentiation observed in Fgfr3(G369C/+) BMSCs are caused by up-regulation of p38 phosphorylation and that enhanced Erk1/2 activity is responsible for the impaired bone matrix mineralization. In addition, in vitro osteoclast formation and bone resorption assays demonstrated that osteoclast numbers and bone resorption area were increased in cultured bone marrow cells derived from Fgfr3(G369C/+) mice. These findings demonstrate that gain-of-function mutation in FGFR3 leads to decreased bone mass by regulating both osteoblast and osteoclast activities. Our studies provide new insight into the mechanism underlying the development of ACH.


Figures

Figure 1.
Figure 1.
Fgfr3G369C/+ mice had decreased bone mass compared with wild-type mice. (A and B) Faxitron X-ray analysis of total femurs from wild-type (+/+) and Fgfr3G369C/+ mice (G369C/+) at 2 months (A) and 4 months (B) of age revealed short and sparse trabeculae in mutant mice (arrows). (C) BMD of femurs from Fgfr3G369C/+ mice was significantly reduced compared with wild-type mice at 2 and 4 months (n = 6). (DI) Quantitative micro-CT analyses of distal femoral metaphysis from wild-type and Fgfr3G369C/+ mice at 2 months. Three-dimensional images showed reduced trabecular bone in mutant mice (D). Quantification of the structural parameters of the femoral metaphysis revealed that BV/TV, Tb.N and Tb.Th were significantly decreased, although Tb.Sp and SMI were significantly increased in mutant mice relative to wild-type mice (n = 6) (E–I). Graphs show mean value ± SD (Student's t-test, *P < 0.05, **P < 0.01).
Figure 2.
Figure 2.
Histochemical analysis of decalcified and undecalcified tibiae from 2-month-old wild-type (+/+) and Fgfr3G369C/+ mice (G369C/+). (A and B) Von Kossa staining of undecalcified tibiae revealed that the proximal tibiae of 2-month-old Fgfr3G369C/+ mice had shorter and sparser trabecular bone compared with wild-type mice (magnification, ×40). (C and D) H&E staining of tibiae showed the morphology of metaphyseal osteoblasts in the proximal tibia. Note that osteoblasts lining trabecular bone in the Fgfr3G369C/+ mice were more plump and cuboidal (arrows; magnification, ×400). (E and F) Von Kossa staining showed that osteoid laid down in the trabecular bone in Fgfr3G369C/+ mice was thicker compared with wild-type mice (red arrows; magnification, ×400). (G and H) Double calcein labeling of undecalcified tibiae. White arrows specify distance between labeled bone surfaces. Labeling for calcein was significantly reduced in the Fgfr3G369C/+ mice (H) compared with wild-type controls (G) (magnification, ×400). (IL) Histomorphometric measurements of tibiae. The tibiae from Fgfr3G369C/+ mice had decreased BV/TV, Tb.Th and MAR, but significantly increased Tb.Sp (n = 5). Graphs show mean value ± SD (Student's t-test, *P < 0.05, **P < 0.01).
Figure 3.
Figure 3.
Serum biochemistry and serum level of PINP of 2-month-old wild-type and Fgfr3G369C/+ mice. (A) There was no remarkable difference of serum level of total Ca and phosphate between wild-type and mutant mice (n = 6). (B) The serum level of PINP measured by ELISA was significantly increased in mutant mice compared with wild-type mice (n = 6). Graphs show mean value ± SD (Student's t-test, **P < 0.01).
Figure 4.
Figure 4.
Effects of activated FGFR3 on the proliferation, osteogenic differentiation and mineralization of BMSCs. (A) MTT proliferation assay showed decreased proliferation of Fgfr3G369C/+ BMSCs. (B) ALP staining showed increased crystal violet-staining cells in cultured Fgfr3G369C/+ BMSCs compared with wild-type BMSCs on day 7, 14 and 21. (C) ALP activity (normalized to the total protein content of the sample, 562 nm) was significantly enhanced in Fgfr3G369C/+ BMSCs. (D) Alizarin red staining of the mineralized osteoblasts showed decreased number of mineralized nodules on day 14 and 21 after osteogenic differentiation in Fgfr3G369C/+ mice. (E) Bound alizarin red was dissolved with 0.5 N HCl, 5% SDS and measured at 415 nm to quantify the mineral content. Cultured Fgfr3G369C/+ BMSCs showed reduced mineral content. (F) Relative expressions of osteogenic marker genes measured by qRT–PCR. The expression levels of Cbfa1, OP, OC and Col1a1 mRNA in differentiated BMSCs were remarkably increased in Fgfr3G369C/+ BMSCs on day 7. Graphs show mean value ± SD (Student's t-test, **P < 0.01).
Figure 5.
Figure 5.
Erk1/2 and p38 MAPK pathway participated in the regulation of BMSCs by FGFR3. (A) Western blot analysis demonstrated that the levels of phospho-Erk1/2 and phospho-p38 were increased in Fgfr3G369C/+ BMSCs cultured in basic medium. (B) Erk1/2 and p38 MAPK pathways were inhibited by PD98059 and SB203580, respectively. (C) The proliferation of both wild-type and Fgfr3G369C/+ BMSCs was decreased in basic medium containing PD98059, but was increased in medium containing SB203580 after 5 days. (D and E) ALP staining and ALP activity analyses of BMSCs treated with PD98059 or SB203580 for 7 days. The ALP activity was increased in Fgfr3G369C/+ BMSCs compared with wild-type BMSCs (##), and it was further enhanced in Fgfr3G369C/+ BMSCs cultured in osteogenic differentiation medium containing PD98059 (**). However, both wild-type and Fgfr3G369C/+ BMSCs treated with SB203580 showed decreased ALP activity compared with untreated BMSCs (**). (F and G) Alizarin red staining and quantification of mineral content of mineralized osteoblasts treated with PD98059 or SB203580 for 14 days. The mineralized nodules and mineral content of both Fgfr3G369C/+ and wild-type BMSCs cultured in differentiation medium containing PD98059 were increased. However, they were significantly reduced after SB203580 treatment. (H and I) Relative expressions of osteogenic genes of BMSCs treated with PD98059 or SB203580 for 7 days. The expression levels of Cbfa1and OC were significantly increased in both wild-type (H) and Fgfr3G369C/+ (I) BMSCs treated with PD98059, however, they were decreased after SB203580 treatment. Graphs show mean value ± SD (Student's t-test, *P < 0.05, **P < 0.01 and ***P < 0.001 versus untreated BMSCs, ##P < 0.01 versus wild-type BMSCs).
Figure 6.
Figure 6.
Enhanced osteoclast formation and bone resorption in Fgfr3G369C/+ mice. (A) TRAP staining of tibiae from 2-month-old mice. Bottom panels show magnified views. A significantly increased number of TRAP-positive osteoclasts lining trabecular bone surfaces (top panels, yellow arrows) and larger resorpted pits (bottom panels, blue arrows) on proximal tibiae were found in Fgfr3G369C/+ mice compared with wild-type mice. (B) Quantification of TRAP-positive cells per unit area of tibiae. Fgfr3G369C/+ mice showed significantly increased number of TRAP-positive cells relative to wild-type mice (n = 4). (C) Representative images of in vitro osteoclast formation using cultures of non-adherent bone marrow cells for 10 days in medium containing 30 ng/ml M-CSF and 50 ng/ml RANKL. Fgfr3G369C/+ mice had increased formation of large, multinuclear TRAP-positive cells compared with wild-type mice (arrows; magnification, top panels ×100, bottom panels ×400). (D) Quantification of osteoclast formation assays in vitro confirmed increased number of osteoclasts defined by TRAP staining in Fgfr3G369C/+ mice. (E) Toluidine blue staining (top panels) and scanning electron microscopy observation (bottom panels) of resorption pits (bottom, arrows) on bovine cortical bone after non-adherent bone marrow cells were cultured in osteoclast differentiation medium for 15 days. These results showed that the area of pits resorpted by Fgfr3G369C/+ osteoclasts was increased compared with wild-type osteoclasts (magnification, top panels ×60, bottom panels ×1000). (F) Quantification of resorption pit areas also revealed significantly increased bone resorption areas in Fgfr3G369C/+ mice (n = 4). (G) Relative expressions of TRAP, Ctsk and MMP-9 mRNA of osteoclasts cultured for 10 days, which showed enhanced expression of TRAP and MMP-9 in Fgfr3G369C/+ osteoclasts. Samples were evaluated in triplicate. Graphs show mean value ± SD (Student's t-test, *P < 0.05, **P < 0.01, ***P < 0.001).
Figure 7.
Figure 7.
The effects of MAPK activated by gain-of-function mutation in FGFR3 on different stages of BMSCs. (A) p38 MAPK pathway inhibits BMSC proliferation, but promotes their osteogenic differentiation. (B) Erk1/2 MAPK pathway inhibits mineralization.

Similar articles

Cited by

References

    1. Ornitz D.M., Marie P.J. FGF signaling pathways in endochondral and intramembranous bone development and human genetic disease. Genes Dev. 2002;16:1446–1465. - PubMed
    1. Su N., Du X., Chen L. FGF signaling: its role in bone development and human skeleton diseases. Front. Biosci. 2008;13:2842–2865. - PubMed
    1. Naski M.C., Ornitz D.M. FGF signaling in skeletal development. Front. Biosci. 1998;3:d781–d794. - PubMed
    1. Ornitz D.M. FGF signaling in the developing endochondral skeleton. Cytokine Growth Factor Rev. 2005;16:205–213. - PMC - PubMed
    1. Toydemir R.M., Brassington A.E., Bayrak-Toydemir P., Krakowiak P.A., Jorde L.B., Whitby F.G., Longo N., Viskochil D.H., Carey J.C., Bamshad M.J. A novel mutation in FGFR3 causes camptodactyly, tall stature, and hearing loss (CATSHL) syndrome. Am. J. Hum. Genet. 2006;79:935–941. - PMC - PubMed

Publication types

Substances