. 2010 Mar 1;21(5):712-24.
doi: 10.1091/mbc.e09-09-0787. Epub 2010 Jan 6.

NPP-16/Nup50 function and CDK-1 inactivation are associated with anoxia-induced prophase arrest in Caenorhabditis elegans

Affiliations

NPP-16/Nup50 function and CDK-1 inactivation are associated with anoxia-induced prophase arrest in Caenorhabditis elegans

Vinita A Hajeri et al. Mol Biol Cell. .

Abstract

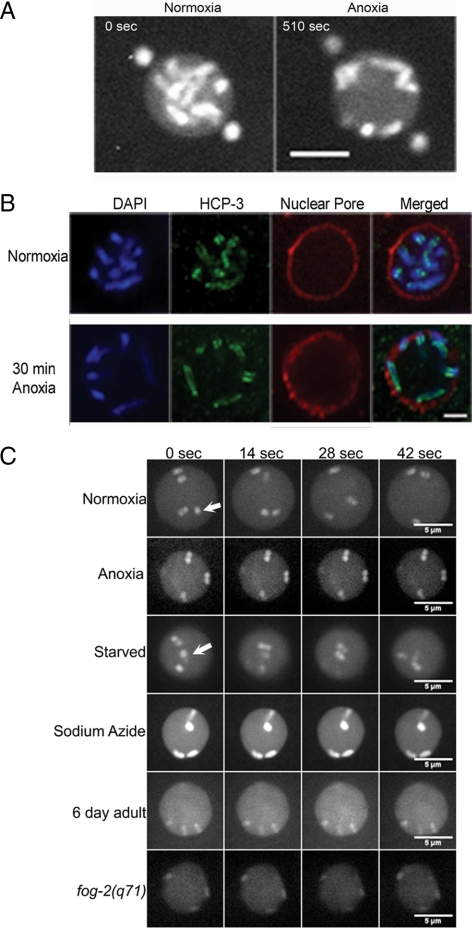
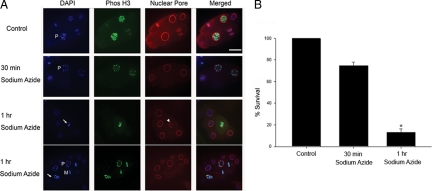
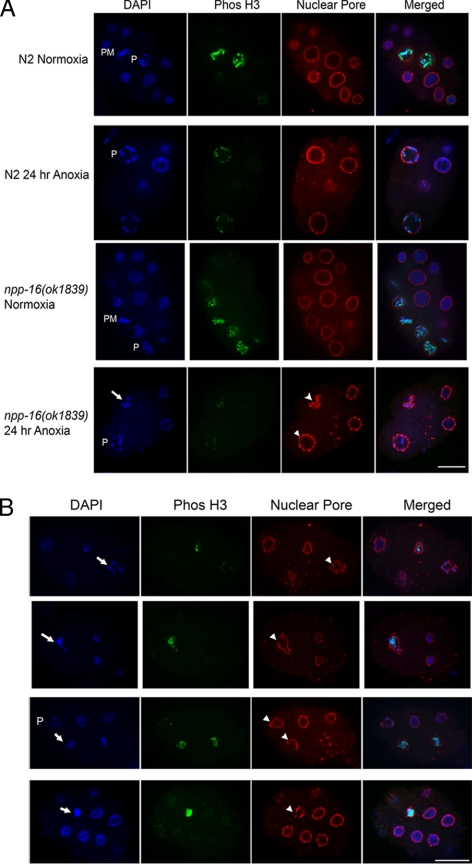
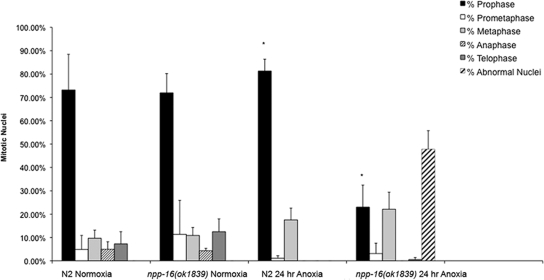
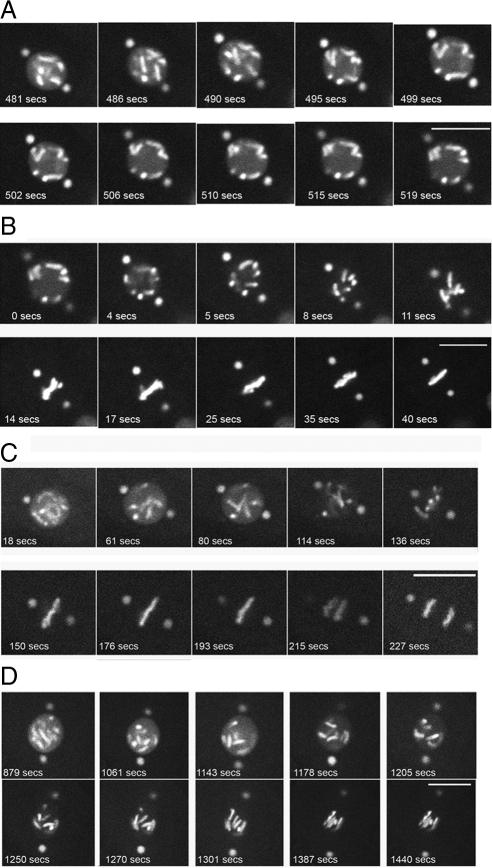
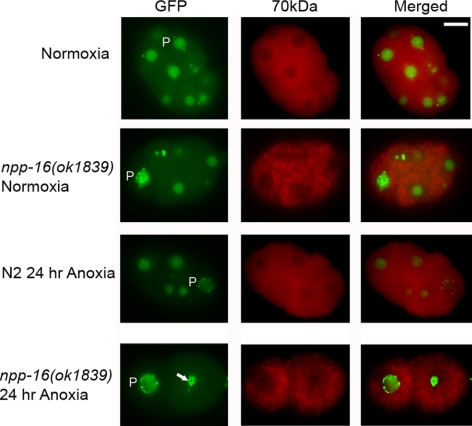
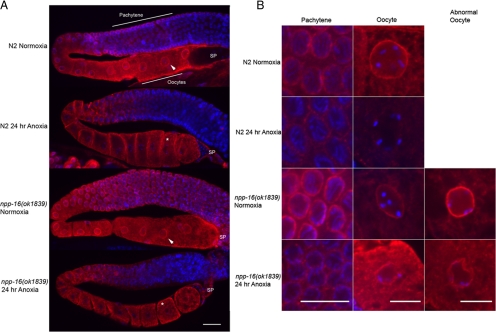
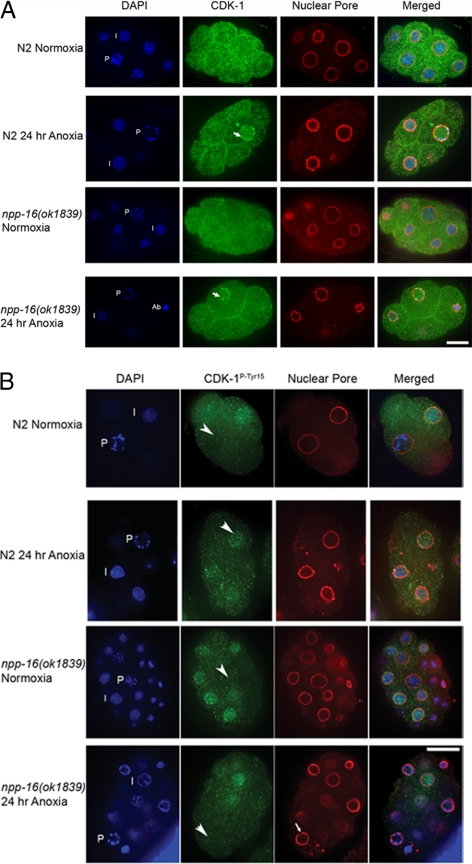
Oxygen, an essential nutrient, is sensed by a multiple of cellular pathways that facilitate the responses to and survival of oxygen deprivation. The Caenorhabditis elegans embryo exposed to severe oxygen deprivation (anoxia) enters a state of suspended animation in which cell cycle progression reversibly arrests at specific stages. The mechanisms regulating interphase, prophase, or metaphase arrest in response to anoxia are not completely understood. Characteristics of arrested prophase blastomeres and oocytes are the alignment of condensed chromosomes at the nuclear periphery and an arrest of nuclear envelope breakdown. Notably, anoxia-induced prophase arrest is suppressed in mutant embryos lacking nucleoporin NPP-16/NUP50 function, indicating that this nucleoporin plays an important role in prophase arrest in wild-type embryos. Although the inactive form of cyclin-dependent kinase (CDK-1) is detected in wild-type-arrested prophase blastomeres, the inactive state is not detected in the anoxia exposed npp-16 mutant. Furthermore, we found that CDK-1 localizes near chromosomes in anoxia-exposed embryos. These data support the notion that NPP-16 and CDK-1 function to arrest prophase blastomeres in C. elegans embryos. The anoxia-induced shift of cells from an actively dividing state to an arrested state reveals a previously uncharacterized prophase checkpoint in the C. elegans embryo.


Figures

Figure 1.
Figure 1.
Chromosomes associate with the nuclear periphery in anoxia-arrested prophase blastomeres and quiescent oocytes. (A) Live cell imaging, using a tbg-1::GFP; pie-1::GFP::H2B strain (TH32), of embryos exposed to normoxia or anoxia (510 s) shows that the anoxia-exposed prophase blastomeres contain chromosomes that are associated with the nuclear periphery, whereas the normoxia exposed blastomeres do not. Scale bar, 5 μm. (B) Embryos exposed to either 30 min of anoxia or normoxia were stained with DAPI to detect DNA, anti-HCP-3 to detect centromeric histone, and mAb414 to recognize the NPC. Three independent experiments were conducted in which a final total of 150 prophase blastomeres from 90 embryos were examined. Scale bar, 2 μm. (C) Live cell imaging, using a tbg-1::GFP; pie-1::GFP::H2B strain (TH32), to analyze the chromosomes in the oocyte of adult control animals exposed to either normoxia, anoxia, starvation, or sodium azide or in a quiescent state due to sperm depletion in aged hermaphrodites or sperm dysfunction in the fog-2(q71) females. Time-lapse analysis was used to track chromosome location within the nucleus. Arrows point to representative chromosomes that move within the nucleus. For each experiment, at least 30 oocytes from three independent experiments were examined. Scale bar, 5 μm.
Figure 2.
Figure 2.
Inhibition of electron transport induces chromosome alignment with the nuclear periphery, nuclear abnormalities, and decreased viability. (A) Embryos exposed to sodium azide and control embryos were stained with DAPI to detect DNA, Phos H3 to detect the mitotic marker phosphorylated Histone H3, and mAb414 to detect NPC. The sodium azide–exposed embryos contain prophase blastomeres (P) with chromosomes associated with inner nuclear membrane, abnormal chromosome structure (arrow), and abnormal NPC (arrowhead). Normal metaphase blastomeres (M) were observed. Three independent experiments were conducted in which a final total of 300 mitotic blastomeres from 90 embryos were examined. Scale bar, 10 μm. (B) Embryos exposed to sodium azide, for the time indicated, washed three times in M9 buffer, and assayed for ability to develop into L1 larvae at 20°C was determined. At least 50 embryos from three independent experiments were assayed. *p < 0.001 in comparison to control, using Student's t test.
Figure 3.
Figure 3.
The npp-16(ok1839) embryo exposed to anoxia has an aberrant nuclear morphology. (A) N2 wild-type and npp-16(ok1839) embryos were stained with DAPI to detect DNA, Phos H3 to detect the mitotic marker phosphorylated Histone H3, and mAb414 to detect NPC. N2 wild-type and npp-16(ok1839) embryos exposed to normoxia contain normal prophase (P) and prometaphase blastomeres (PM). N2 wild-type embryos exposed to anoxia contain prophase blastomeres in which the chromosomes align with the nuclear periphery (P). The npp-16(ok1839) embryos exposed to anoxia contain prophase blastomeres with chromosomes that align with the nuclear periphery (P) and blastomeres with abnormal chromosome structure (arrow) or abnormal NPC structure/aggregates (arrowhead). Three independent experiments were conducted in which a final total of 250 mitotic blastomeres from 90 embryos were examined. Scale bar, 10 μm. (B) Various chromosomal abnormalities are observed in npp-16(ok1839) embryos exposed to anoxia. Embryos were stained with DAPI to detect DNA, Phos H3 to detect the mitotic marker phosphorylated Histone H3, and mAb414 to detect NPC. Arrow points to abnormal chromosome structure; arrowhead points toward abnormal NPC distribution. These abnormalities are associated with mitotic nuclei of embryos exposed to anoxia. Scale bar, 10 μm.
Figure 4.
Figure 4.
The mitotic index for N2 control and npp-16(ok1839) embryos exposed to normoxia or anoxia. The percentage of nuclei at various stages of mitosis, and the percentage of abnormal nuclei was quantified. The abnormal nuclei were positive for PhosH3 staining, indicating that these nuclei were mitotic. In comparison to N2 control embryos exposed to 24 h of anoxia, the number of prophase blastomeres significantly decreased and the number of abnormal nuclei significantly increased in npp-16(ok1839) embryos exposed to 24-h anoxia (*p < 0.001 using a Student's t test). Abnormal nuclei were observed in npp-16(ok1839) embryos exposed to 24-h anoxia. Three independent experiments were conducted in which a final total of 200 mitotic blastomeres from at least 60 embryos (2–20 cell stage) were examined.
Figure 5.
Figure 5.
The arrested npp-16(ok1839) prophase blastomere is abnormal. Live cell imaging analysis, of control TH32 strain and npp-16(ok1839) crossed into the TH32 background, to visualize chromosome location and mitotic progression. Shown are representative images from a time-lapse microscopy experiment to assay the nuclei of prophase blastomeres in control embryos exposed to anoxia (A) or after anoxia (B) and nuclei of prophase blastomeres in npp-16(ok1839) embryos exposed to normoxia (C) or anoxia (D). For each data set, a total of at least 10 prophase blastomeres were examined. The N2 gas flow-through chamber was used to expose animals to anoxia. Scale bar, 5 μm.
Figure 6.
Figure 6.
The permeability of the nuclear envelope in npp-16(ok1839) embryos is not completely compromised. The permeability of the nuclear envelope was monitored using fluorescently labeled dextran (TRITC-labeled 70-kDa dextran) in the context of cell cycle position (TH32 strain used) in control and npp-16(ok1839) embryos exposed to normoxia or 24 h of anoxia. The letter P is left of prophase a blastomere, and arrow points to a nuclei with abnormal chromosome structure. In these experiments at least 57 blastomeres from 16 or more embryos were analyzed (see Table S1). Scale bar, 10 μm.
Figure 7.
Figure 7.
The germline of wild-type and npp-16(ok139) adult hermaphrodites exposed to normoxia or anoxia. Shown are representative images of N2 wild-type and npp-16(ok1839) adult gonads dissected and stained with DAPI to detect DNA and mAb414 to detect NPC. Either the entire gonad region is shown (A) or an enlarged image of the pachytene region, normal oocytes, or abnormal oocytes (B). In A the NPC is noted by an arrowhead, SP denotes the spermatheca region, and asterisk notes the observation that in anoxia-exposed animals the mAb414 detection accumulates at the cortical region of the oocyte. Note that in comparison to control, the anoxia-exposed animals the localization of mAb414 appears more dispersed within the pachytene region of the gonad (B). We classified oocytes as abnormal if the bivalent chromosomes associated with the nuclear periphery under normoxic conditions or if the nuclear membrane shape was not round/oblong and appeared to have invaginations or folds (B). Quantification of these phenotypes and the number of animals and oocytes analyzed are noted in Table S2. Scale bars, 10 μm.
Figure 8.
Figure 8.
Activity state of cyclin-dependent kinase (CDK-1) differs in control and npp-16(ok1839) arrested prophase blastomeres. The npp-16(ok1839) and N2 wild-type embryos, exposed to either normoxia or anoxia, were stained with DAPI to detect DNA, mAb414 to detect NPC, and either anti-CDK-1 (A) or anti CDK-1P-Tyr15 (B). Prophase blastomeres (P), interphase blastomeres (I), and abnormal nuclei (Ab) are denoted as such. (A) Arrow points to prophase blastomeres in which anti-CDK-1 is detected near the proximity of chromosomes associated with the inner nuclear periphery. (B) Arrowhead points to prophase blastomeres. Note the detection of inactive CDK-1 in the nucleus of arrested N2 prophase blastomeres but the absence in the nucleus of arrested npp-16(ok1839) prophase blastomeres. (B) The arrow points to a blastomere in which the distribution of NPC is discontinuous in the npp-16(ok1839) embryo exposed to anoxia. For each data set three independent experiments were conducted in which a final total of 100 blastomeres from at least 50 embryos were examined. Scale bar, 10 μm.

Similar articles

Cited by

References

    1. Akhtar A., Gasser S. M. The nuclear envelope and transcriptional control. Nat. Rev. Genet. 2007;8:507–517. - PubMed
    1. Anderson D. J., Hetzer M. W. The life cycle of the metazoan nuclear envelope. Curr. Opin. Cell Biol. 2008;20:386–392. - PMC - PubMed
    1. Angelo G., Van Gilst M. R. Starvation protects germline stem cells and extends reproductive longevity in C. elegans. Science. 2009;326:954–958. - PubMed
    1. Beaudouin J., Gerlich D., Daigle N., Eils R., Ellenberg J. Nuclear envelope breakdown proceeds by microtubule-induced tearing of the lamina. Cell. 2002;108:83–96. - PubMed
    1. Bentley A. M., Normand G., Hoyt J., King R. W. Distinct sequence elements of cyclin B1 promote localization to chromatin, centrosomes, and kinetochores during mitosis. Mol. Biol. Cell. 2007;18:4847–4858. - PMC - PubMed

Publication types

MeSH terms

LinkOut - more resources