. 2010 Mar;84(6):2881-92.
doi: 10.1128/JVI.02229-09. Epub 2010 Jan 6.

Two kinetic patterns of epitope-specific CD8 T-cell responses following murine gammaherpesvirus 68 infection

Affiliations

Two kinetic patterns of epitope-specific CD8 T-cell responses following murine gammaherpesvirus 68 infection

Michael L Freeman et al. J Virol. 2010 Mar.

Abstract

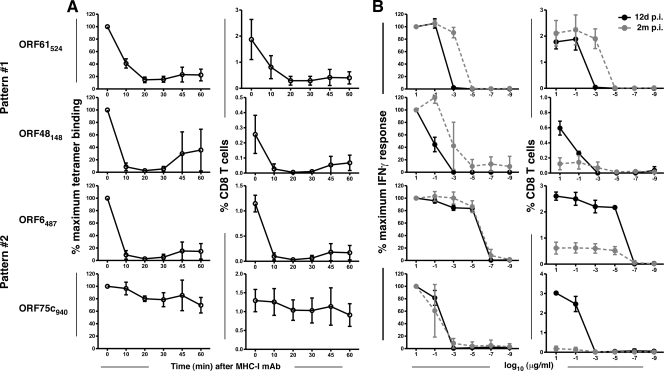
Murine gammaherpesvirus 68 (gammaHV68) provides an important experimental model for understanding mechanisms of immune control of the latent human gammaherpesviruses. Antiviral CD8 T cells play a key role throughout three separate phases of the infection: clearance of lytic virus, control of the latency amplification stage, and prevention of reactivation of latently infected cells. Previous analyses have shown that T-cell responses to two well-characterized epitopes derived from ORF6 and ORF61 progress with distinct kinetics. ORF6(487)-specific cells predominate early in infection and then decline rapidly, whereas ORF61(524)-specific cells continue to expand through early latency, due to sustained epitope expression. However, the paucity of identified epitopes to this virus has limited our understanding of the overall complexities of CD8 T-cell immune control throughout infection. Here we screened 1,383 predicted H-2(b)-restricted peptides and identified 33 responses, of which 21 have not previously been reported. Kinetic analysis revealed a spectrum of T-cell responses based on the rapidity of their decline after the peak acute response that generally corresponded to the expression patterns of the two previously characterized epitopes. The slowly declining responses that were maintained during latency amplification proliferated more rapidly and underwent maturation of functional avidity over time. Furthermore, the kinetics of decline was accelerated following infection with a latency-null mutant virus. Overall, the data show that gammaHV68 infection elicits a highly heterogeneous CD8 T-cell response that segregates into two distinctive kinetic patterns controlled by differential epitope expression during the lytic and latency amplification stages of infection.


Figures

FIG. 1.
FIG. 1.
Robust early CD8 T-cell response to γHV68. (A) Mice were infected with 400 PFU γHV68; at the given times, splenocytes were harvested, and 106 cells were stimulated for 48 h with 5 × 10⁵ irradiated APCs pulsed with peptides or the medium control in a standard ELISpot assay for IFN-γ. The numbers of spots per 106 cells minus the medium control (±standard deviations [SD]) are shown. The dashed line is at 30 spots above background at 12 days p.i. Samples were run in duplicate per experiment, and data are from 3 or 4 experiments per time point. (B) The number of predicted MHC-I binding epitopes per open reading frame (ORF) is shown versus the amino acid length of the protein. r2 is 0.6904.
FIG. 2.
FIG. 2.
Comparison of MHC-I binding affinities. The log10 concentrations of peptide yielding 50% inhibition of binding of radiolabeled peptide (IC50s) are shown for 21 previously published epitopes and the 21 epitopes newly identified in this report (Table 1). ***, P < 0.0001 (Student's t test).
FIG. 3.
FIG. 3.
Two patterns of CD8 T-cell response kinetics. (A and B) CD8 T cells from infected mice were stimulated for 5 h in the presence of brefeldin-A with congenic splenocytes pulsed with the indicated peptides and then analyzed by flow cytometry. The percentage of CD8 T cells that produced IFN-γ was normalized to the percentage at 12 days after infection. (A) Pattern 1 responses maintained 40% or greater of the 12-day value at 49 days after infection (n = 3/group). (B) Pattern 2 responses maintained less than 40% of the 12-day value at 49 days after infection (n = 3/group). (C) The IC50 values for the 11 pattern 1 and 4 pattern 2 responses are shown. ns, not significant (Student's t test).
FIG. 4.
FIG. 4.
Multifunctionality of γHV68-specific responses. (A) CD8 T cells were analyzed by intracellular flow cytometry for IFN-γ and TNF-α synthesis following 5 h of stimulation with the indicated peptides. Numbers indicate the percentages of CD8 T cells in the quadrant. Data are representative of 3 experiments per time point. (B) T-cell cytotoxicity was measured in vivo. Infected mice were injected with CFSE-labeled congenic splenocytes that had been pulsed with a γHV68 peptide epitope or influenza virus NP366 epitope as a negative control. Spleens were harvested 16 h later, and specific killing was calculated as described in Materials and Methods. Data are representative of at least 3 experiments per time point.
FIG. 5.
FIG. 5.
CD8 T-cell responses maintain functionality, but are reduced numerically over time. (A) Spleens were harvested from γHV68-infected mice at the indicated times, and cells were stained with an MHC-I tetramer and antibody to CD8. Zebra plots are representative of at least 3 experiments. Numbers indicate percentages of lymphocytes positive for CD8 and the tetramer. (B) Shown are the percentages of CD8 T cells that produced IFN-γ in response to peptide stimulation versus the percentages of CD8 T cells that bound that particular MHC-I tetramer at all time points tested. r2 values are as follows: ORF61524, 0.9515; ORF48148, 0.9441; ORF6487, 0.9518; ORF75c940, 0.9763 (n = 20/group). (C) At 41 days p.i., spleens were harvested and stained with antibodies to CD8, the tetramer, and TCR Vβ4. Numbers indicate percentages of CD8 T cells in each quadrant (n = 3).
FIG. 6.
FIG. 6.
The two patterns exhibit differential proliferation rates. At various times after infection, mice were treated with BrdU in their drinking water for 4 consecutive days. At the end of treatment, spleens were harvested and stained with a tetramer and antibodies to CD8 and CD44. CD8 T cells were measured for BrdU incorporation. (A) Representative histograms show incorporation by CD44lo CD8 T cells and CD44hi CD8 T cells. (B) The percentages of tetramer+ cells that incorporated BrdU are shown (n = 5 to 10/group).
FIG. 7.
FIG. 7.
Prolonged activation of ORF61524-specific responses. At various times after infection spleens were harvested and stained with a tetramer and the indicated antibodies. Representative zebra plots show staining of tetramer+ CD8 T cells with CD27 and CD43 (A) or CD127 and KLRG-1 (C). Numbers in plots show the percentages of tetramer+ cells in each quadrant. Plots are representative of at least 3 experiments. The percentages of tetramer+ cells that are CD27hi CD43hi (B), CD127hi (D), or KLRG1hi (E) are shown.
FIG. 8.
FIG. 8.
Functional avidity maturation occurs for pattern 1 responses. (A) TCR affinity was measured by staining cells with a tetramer for 1 h followed by incubation with anti-H-2Kb/Db antibody at 37°C to observe tetramer dissociation. Cells were then stained with anti-CD8 and analyzed by flow cytometry. Data represent the percentages of tetramer+ CD8 T cells expressed as percentages (±SD) of maximum binding at time zero (left column) or as raw data showing the percentages (±SD) of CD8 T cells (right column). (B) Functional avidity was measured by stimulating cells for 5 h in the presence of the designated concentration of antigen and brefeldin-A and then staining for intracellular accumulation of IFN-γ. For each time point, data represent the percentages of cells positive for IFN-γ expressed as percentages (±SD) of the 10-μg/ml value (left column) or as raw data showing the percentages (±SD) of CD8 T cells (right column) (n = 2 or 3/concentration).
FIG. 9.
FIG. 9.
Pattern 1 cells require viral latency for optimal responses. Viral titers (±SD; n = 3/group) in the lungs (A) and infective centers in the spleen (B) following wild-type (WT) γHV68 infection or AC-RTA infection. (C) Forty-one days after infection spleens were harvested and stained with antibodies to CD8 and TCR Vβ4. Numbers indicate percentages of CD8 T cells expressing Vβ4 (n = 3/group). (D) Number (±SD) of tetramer+ CD8 T cells over time (n = 3 to 6/group; data representative of 3 experiments). *, P < 0.05; **, P < 0.01 (Student's t test).

References

    1. Alter, G., J. M. Malenfant, and M. Altfeld. 2004. CD107a as a functional marker for the identification of natural killer cell activity. J. Immunol. Methods 294:15-22. - PubMed
    1. Blattman, J. N., E. J. Wherry, S. J. Ha, R. G. van der Most, and R. Ahmed. 2009. Impact of epitope escape on PD-1 expression and CD8 T-cell exhaustion during chronic infection. J. Virol. 83:4386-4394. - PMC - PubMed
    1. Cheng, Y., and W. H. Prusoff. 1973. Relationship between the inhibition constant (K1) and the concentration of inhibitor which causes 50 per cent inhibition (I50) of an enzymatic reaction. Biochem. Pharmacol. 22:3099-3108. - PubMed
    1. Coppola, M. A., E. Flano, P. Nguyen, C. L. Hardy, R. D. Cardin, N. Shastri, D. L. Woodland, and M. A. Blackman. 1999. Apparent MHC-independent stimulation of CD8+ T cells in vivo during latent murine gammaherpesvirus infection. J. Immunol. 163:1481-1489. - PubMed
    1. Cush, S. S., K. M. Anderson, D. H. Ravneberg, J. L. Weslow-Schmidt, and E. Flano. 2007. Memory generation and maintenance of CD8+ T cell function during viral persistence. J. Immunol. 179:141-153. - PMC - PubMed

Publication types

MeSH terms