. 2010 Mar;84(6):2657-65.
doi: 10.1128/JVI.02124-09. Epub 2010 Jan 6.

No increase in hepatitis B virus (HBV)-specific CD8+ T cells in patients with HIV-1-HBV coinfections following HBV-active highly active antiretroviral therapy

Affiliations

No increase in hepatitis B virus (HBV)-specific CD8+ T cells in patients with HIV-1-HBV coinfections following HBV-active highly active antiretroviral therapy

Megan Crane et al. J Virol. 2010 Mar.

Abstract

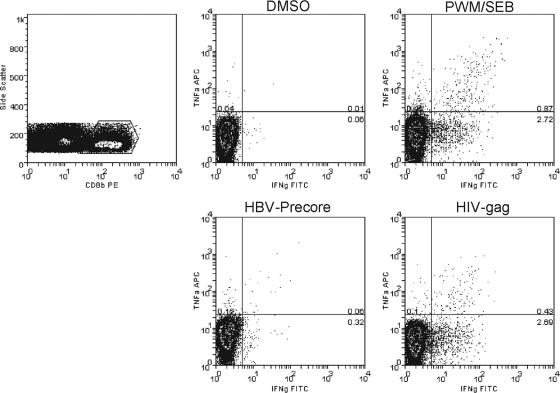
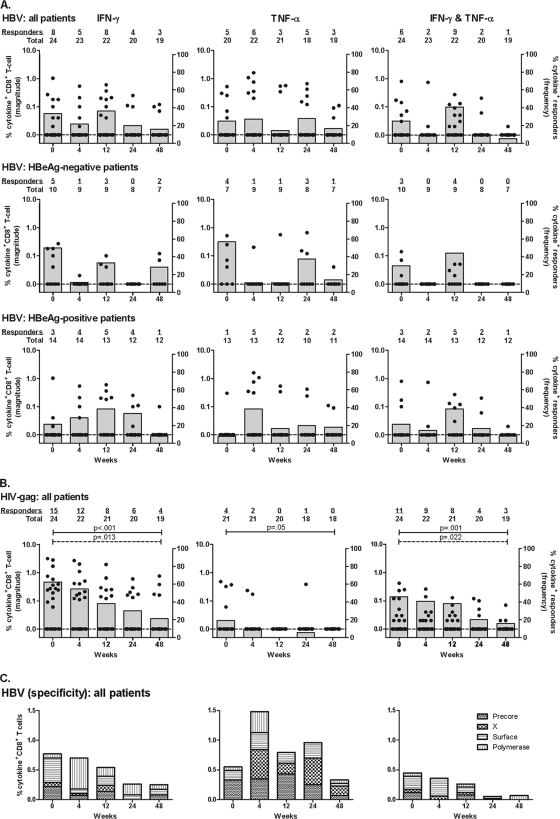
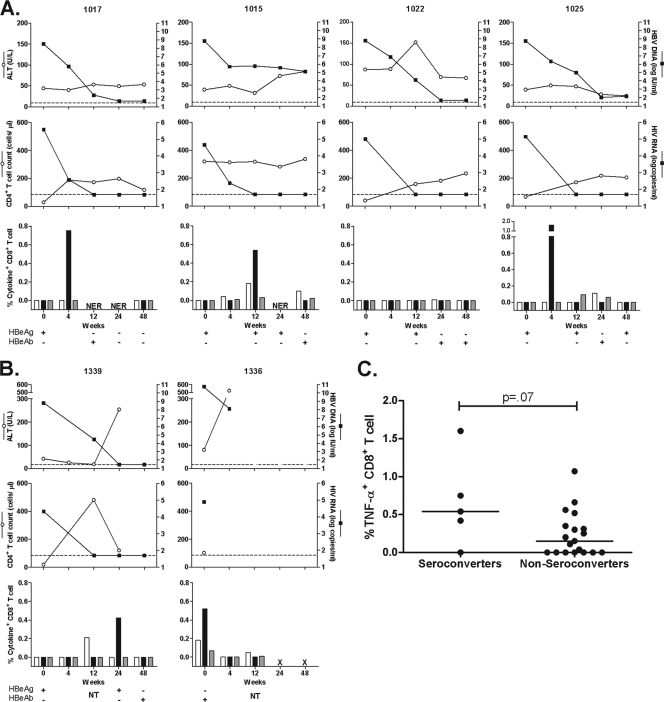
Following treatment of hepatitis B virus (HBV) monoinfection, HBV-specific T-cell responses increase significantly; however, little is known about the recovery of HBV-specific T-cell responses following HBV-active highly active antiretroviral therapy (HAART) in HIV-HBV coinfected patients. HIV-HBV coinfected patients who were treatment naïve and initiating HBV-active HAART were recruited as part of a prospective cohort study in Thailand and followed for 48 weeks (n = 24). Production of gamma interferon (IFN-gamma) and tumor necrosis factor alpha (TNF-alpha) in both HBV- and HIV-specific CD8(+) T cells was quantified using intracellular cytokine staining on whole blood. Following HBV-active HAART, the median (interquartile range) log decline from week 0 to week 48 for HBV DNA was 5.8 log (range, 3.4 to 6.7) IU/ml, and for HIV RNA it was 3.1 (range, 2.9 to 3.5) log copies/ml (P < 0.001 for both). The frequency of HIV Gag-specific CD8(+) T-cell responses significantly decreased (IFN-gamma, P < 0.001; TNF-alpha, P = 0.05). In contrast, there was no significant change in the frequency (IFN-gamma, P = 0.21; TNF-alpha, P = 0.61; and IFN-gamma and TNF-alpha, P = 0.11) or magnitude (IFN-gamma, P = 0.13; TNF-alpha, P = 0.13; and IFN-gamma and TNF-alpha, P = 0.13) of HBV-specific CD8(+) T-cell responses over 48 weeks of HBV-active HAART. Of the 14 individuals who were HBV e antigen (HBeAg) positive, 5/14 (36%) lost HBeAg during the 48 weeks of follow-up. HBV-specific CD8(+) T cells were detected in 4/5 (80%) of patients prior to HBeAg loss. Results from this study show no sustained change in the HBV-specific CD8(+) T-cell response following HBV-active HAART. These findings may have implications for the duration of treatment of HBV in HIV-HBV coinfected patients, particularly in HBeAg-positive disease.


Figures

FIG. 1.
FIG. 1.
ICS for HBV-specific CD8+ T cells. CD8+ T cells were identified by forward and side scatter and expression of CD8-PE. Data from at least 8,000 CD8+ T cells were collected for analysis. The percentage of HBV-specific T cells was defined as the percentage of cytokine-producing CD8+ T cells. A positive response was considered to be >0.05% cytokine+ CD8+ T cells above background (the response to stimulation with DMSO and costimulatory molecules alone) and also at least 2-fold above background. The positive control included pokeweed mitogen/staphylococcal enterotoxin (PWM/SEB). A representative example from an HIV-HBV-coinfected patient with production of either TNF-α or IFN-γ or both cytokines from CD8+ T cells to DMSO, PWM/SEB, HBV precore protein, and HIV Gag peptides is shown.
FIG. 2.
FIG. 2.
Magnitude, frequency, and specificity of antigen-specific CD8+ T-cell responses following HBV-active HAART. The magnitude and frequency of the antigen-specific CD8+ T-cell response as measured by IFN-γ (left panels), TNF-α (middle panels), or both IFN-γ and TNF-α (right panels) production are shown for the HBV-specific CD8+ T-cell response in all patients (top row), HBeAg-negative patients (second row), and HBeAg-positive patients (third row) (A) and for the HIV Gag-specific CD8+ T cell-response in all patients (B). The magnitude of cytokine production (percent cytokine-positive CD8+ T cells; black circles and left axis) and the frequency of patient responses (percentage of patients who had a response above zero/total evaluable responses; gray columns and right axis) are shown. (C) Specificity of the HBV peptide pool response. The mean magnitude of the positive HBV-specific responses to each HBV gene product (precore, X, surface, and polymerase) is shown. In panel B, P values for frequency (chi-square test for trend in frequencies) are indicated using solid lines, and significant changes in magnitude (GEE) are shown using dotted lines.
FIG. 3.
FIG. 3.
Changes in clinical parameters and HBV-specific CD8+ T cells in patients who underwent HBeAg seroconversion or hepatic flare. (A) Five HBeAg-positive patients lost HBeAg and/or developed HBeAb during the 48-week treatment period. (B) Two patients had a hepatic flare including, one patient who had both a flare and HBeAg seroconversion (1339). (C) The median peak TNF-α response of the HBeAg-positive seroconverters (n = 5) and the remaining nonseroconverting patients (n = 19). Patient numbers are indicated above the graphs, and symbols and units are identified along the vertical axes. In the bottom rows of panels A and B, the bars represent the following: white, IFN-γ; black, TNF-α; gray, TNF-α and IFN-γ. The lower limit of detection for HIV RNA was 50 copies/ml. Patient 1336 died at week 12 and therefore did not complete 48 weeks of follow-up. NT, not tested (due to patient death [x] or no sample available); NER, no evaluable response (due to no response to the mitogen-positive control).

Similar articles

Cited by

References

    1. Alatrakchi, N., C. Duvivier, D. Costagliola, A. Samri, A. G. Marcelin, G. Kamkamidze, M. Astriti, R. Agher, V. Calvez, B. Autran, and C. Katlama. 2005. Persistent low viral load on antiretroviral therapy is associated with T cell-mediated control of HIV replication. AIDS 19:25-33. - PubMed
    1. Appay, V., D. C. Douek, and D. A. Price. 2008. CD8+ T cell efficacy in vaccination and disease. Nat. Med. 14:623-628. - PubMed
    1. Bedossa, P., and T. Poynard. 1996. An algorithm for the grading of activity in chronic hepatitis C. The METAVIR Cooperative Study Group. Hepatology 24:289-293. - PubMed
    1. Betts, M. R., M. C. Nason, S. M. West, S. C. De Rosa, S. A. Migueles, J. Abraham, M. M. Lederman, J. M. Benito, P. A. Goepfert, M. Connors, M. Roederer, and R. A. Koup. 2006. HIV nonprogressors preferentially maintain highly functional HIV-specific CD8+ T cells. Blood 107:4781-4789. - PMC - PubMed
    1. Boni, C., A. Penna, A. Bertoletti, V. Lamonaca, I. Rapti, G. Missale, M. Pilli, S. Urbani, A. Cavalli, S. Cerioni, R. Panebianco, J. Jenkins, and C. Ferrari. 2003. Transient restoration of anti-viral T cell responses induced by lamivudine therapy in chronic hepatitis B. J. Hepatol. 39:595-605. - PubMed

Publication types