

cAMP stimulates apical V-ATPase accumulation, microvillar elongation, and proton extrusion in kidney collecting duct A-intercalated cells
- PMID: 20053793
- PMCID: PMC2838605
- DOI: 10.1152/ajprenal.00584.2009
cAMP stimulates apical V-ATPase accumulation, microvillar elongation, and proton extrusion in kidney collecting duct A-intercalated cells
Abstract
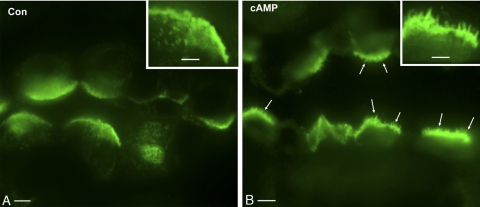
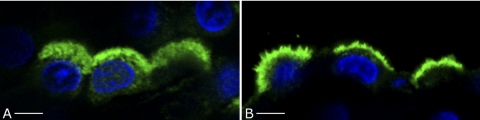
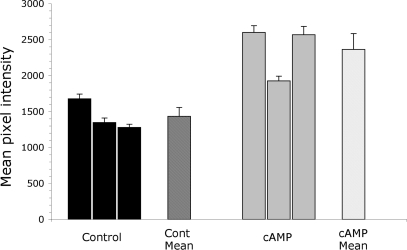
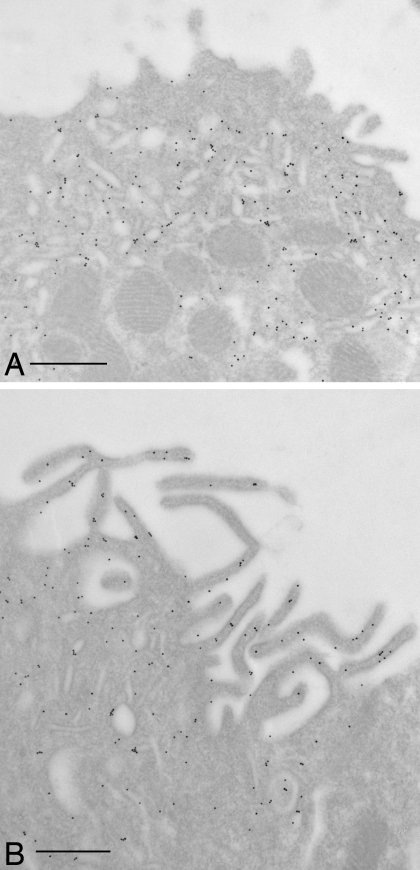
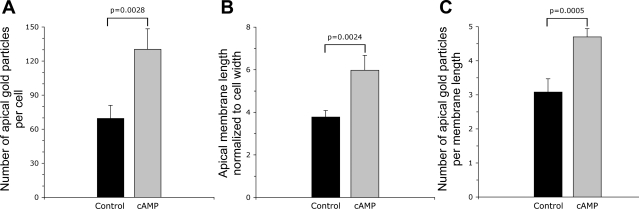
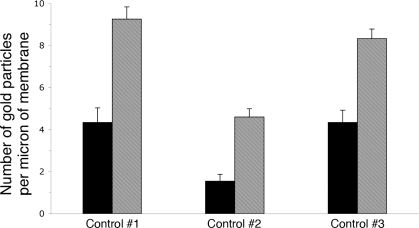
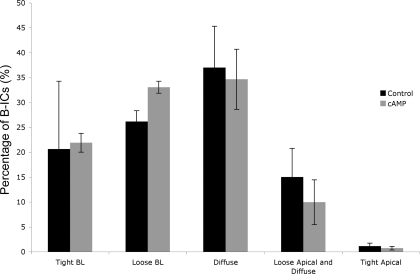
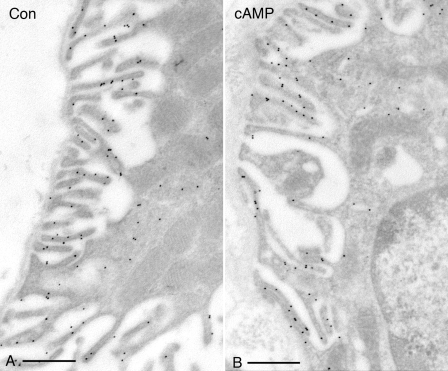
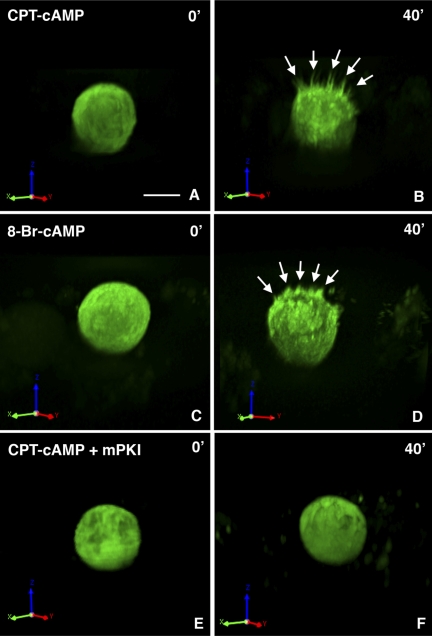
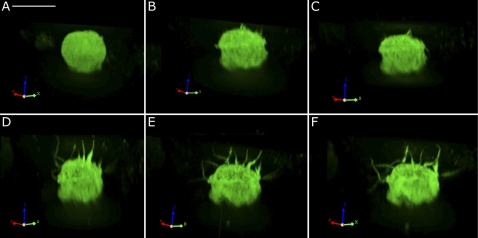
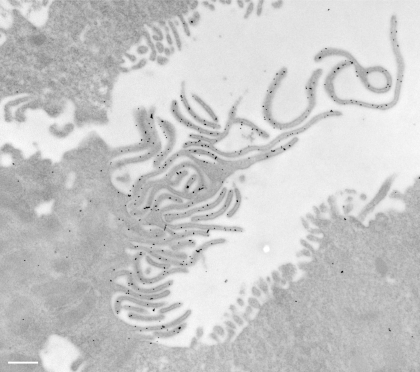
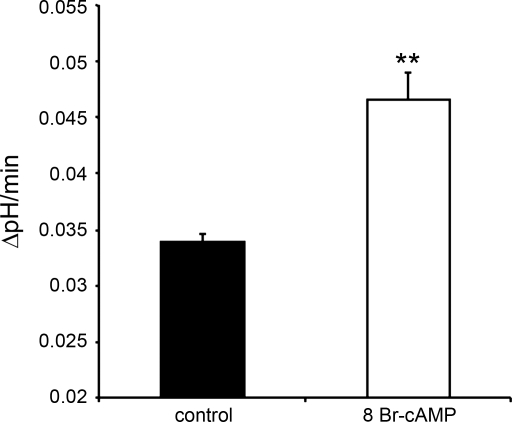
Kidney proton-secreting A-intercalated cells (A-IC) respond to systemic acidosis by accumulating the vacuolar ATPase (V-ATPase) in their apical membrane and by increasing the length and number of apical microvilli. We show here that the cell-permeant cAMP analog CPT-cAMP, infused in vivo, results in an almost twofold increase in apical V-ATPase accumulation in AE1-positive A-IC within 15 min and that these cells develop an extensive array of apical microvilli compared with controls. In contrast, no significant change in V-ATPase distribution could be detected by immunocytochemistry in B-intercalated cells at the acute time point examined. To show a direct effect of cAMP on A-IC, we prepared cell suspensions from the medulla of transgenic mice expressing EGFP in IC (driven by the B1-subunit promoter of the V-ATPase) and exposed them to cAMP analogs in vitro. Three-dimensional reconstructions of confocal images revealed that cAMP induced a time-dependent growth of apical microvilli, starting within minutes after addition. This effect was blocked by the PKA inhibitor myristoylated PKI. These morphological changes were paralleled by increased cAMP-mediated proton extrusion (pHi recovery) by A-IC in outer medullary collecting ducts measured using the ratiometric probe BCECF. These results, and our prior data showing that the bicarbonate-stimulated soluble adenylyl cyclase (sAC) is highly expressed in kidney intercalated cells, support the idea that cAMP generated either by sAC, or by activation of other signaling pathways, is part of the signal transduction mechanism involved in acid-base sensing and V-ATPase membrane trafficking in kidney intercalated cells.
Figures
Similar articles
-
Alkaline pH- and cAMP-induced V-ATPase membrane accumulation is mediated by protein kinase A in epididymal clear cells.Am J Physiol Cell Physiol. 2008 Feb;294(2):C488-94. doi: 10.1152/ajpcell.00537.2007. Epub 2007 Dec 26. Am J Physiol Cell Physiol. 2008. PMID: 18160485 Free PMC article.
-
Vacuolar H+-ATPase apical accumulation in kidney intercalated cells is regulated by PKA and AMP-activated protein kinase.Am J Physiol Renal Physiol. 2010 May;298(5):F1162-9. doi: 10.1152/ajprenal.00645.2009. Epub 2010 Feb 10. Am J Physiol Renal Physiol. 2010. PMID: 20147366 Free PMC article.
-
Regulation of proximal tubule vacuolar H(+)-ATPase by PKA and AMP-activated protein kinase.Am J Physiol Renal Physiol. 2014 May 1;306(9):F981-95. doi: 10.1152/ajprenal.00362.2013. Epub 2014 Feb 19. Am J Physiol Renal Physiol. 2014. PMID: 24553431 Free PMC article.
-
H(+)V-ATPase-dependent luminal acidification in the kidney collecting duct and the epididymis/vas deferens: vesicle recycling and transcytotic pathways.J Exp Biol. 2000 Jan;203(Pt 1):137-45. doi: 10.1242/jeb.203.1.137. J Exp Biol. 2000. PMID: 10600682 Review.
-
Regulated acid-base transport in the collecting duct.Pflugers Arch. 2009 May;458(1):137-56. doi: 10.1007/s00424-009-0657-z. Epub 2009 Mar 7. Pflugers Arch. 2009. PMID: 19277700 Review.
Cited by
-
Loss of the V-ATPase B1 subunit isoform expressed in non-neuronal cells of the mouse olfactory epithelium impairs olfactory function.PLoS One. 2012;7(9):e45395. doi: 10.1371/journal.pone.0045395. Epub 2012 Sep 20. PLoS One. 2012. PMID: 23028982 Free PMC article.
-
Recent Insights into the Structure, Regulation, and Function of the V-ATPases.Trends Biochem Sci. 2015 Oct;40(10):611-622. doi: 10.1016/j.tibs.2015.08.005. Trends Biochem Sci. 2015. PMID: 26410601 Free PMC article. Review.
-
Cyclic Adenosine Monophosphate Signaling in Chronic Kidney Disease: Molecular Targets and Therapeutic Potentials.Int J Mol Sci. 2024 Aug 30;25(17):9441. doi: 10.3390/ijms25179441. Int J Mol Sci. 2024. PMID: 39273390 Free PMC article. Review.
-
Regulation of luminal acidification by the V-ATPase.Physiology (Bethesda). 2013 Sep;28(5):318-29. doi: 10.1152/physiol.00007.2013. Physiology (Bethesda). 2013. PMID: 23997191 Free PMC article. Review.
-
Adenylyl cyclase 4 does not regulate collecting duct water and sodium handling.Physiol Rep. 2014 Mar 27;2(3):e00277. doi: 10.1002/phy2.277. Print 2014. Physiol Rep. 2014. PMID: 24760529 Free PMC article.
References
-
- Al-Awqati Q. Terminal differentiation of intercalated cells: the role of hensin. Annu Rev Physiol 65: 567–583, 2003 - PubMed
-
- Alper SL. Genetic diseases of acid-base transporters. Annu Rev Physiol 64: 899–923, 2002 - PubMed
-
- Bagnis C, Marshansky V, Breton S, Brown D. Remodeling the cellular profile of collecting ducts by chronic carbonic anhydrase inhibition. Am J Physiol Renal Physiol 280: F437–F448, 2001 - PubMed
-
- Bastani B, Haragsim L. Immunocytochemistry of renal H-ATPase. Miner Electrolyte Metab 22: 382–395, 1996 - PubMed
Publication types
MeSH terms
Substances
Grants and funding
LinkOut - more resources
Full Text Sources
Miscellaneous