Comparative Study
. 2010 Jan 6;30(1):81-92.
doi: 10.1523/JNEUROSCI.5656-08.2010.

Neonatal cerebral hypoxia-ischemia impairs plasticity in rat visual cortex

Affiliations
Comparative Study

Neonatal cerebral hypoxia-ischemia impairs plasticity in rat visual cortex

Samuel Failor et al. J Neurosci. .

Abstract

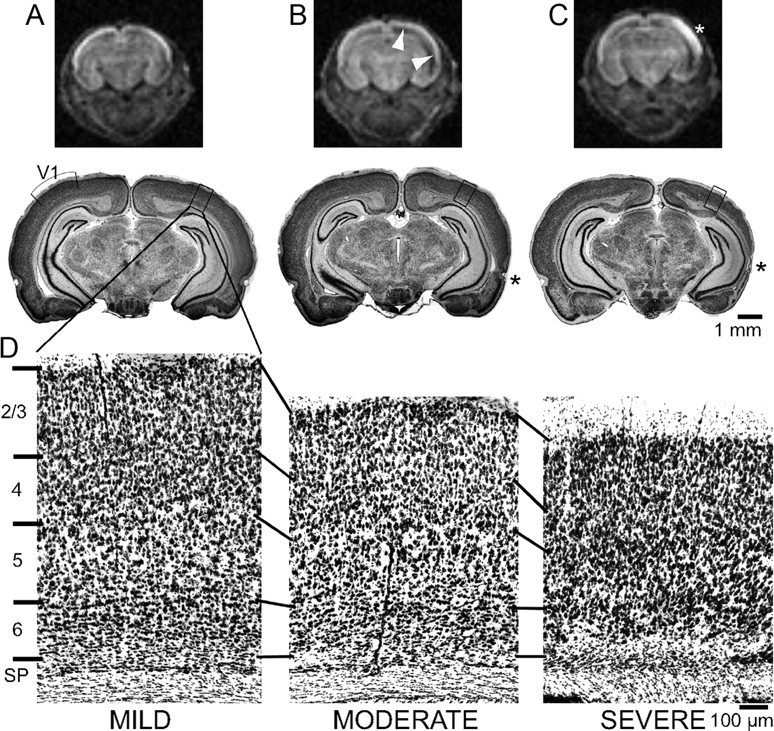
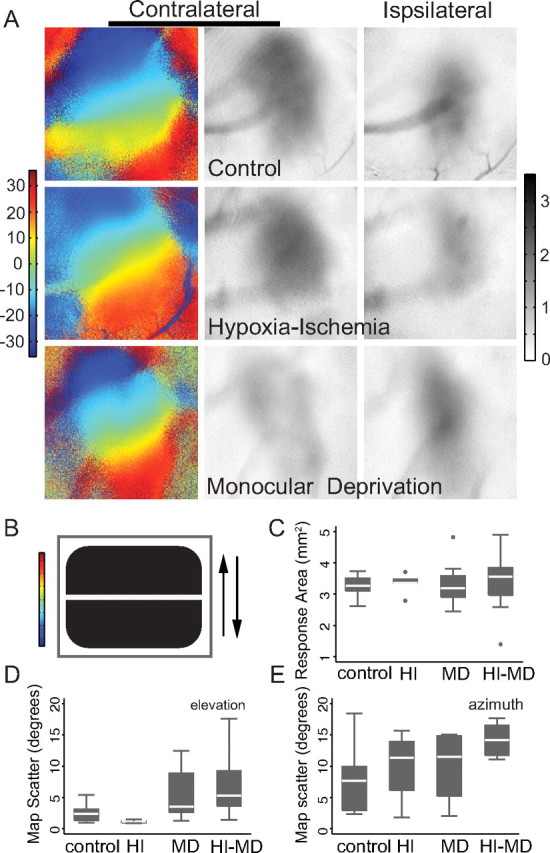
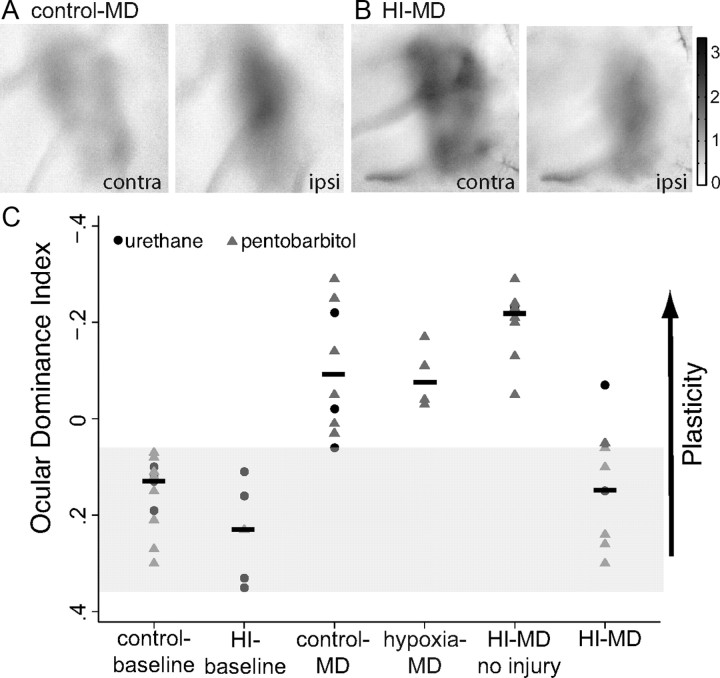
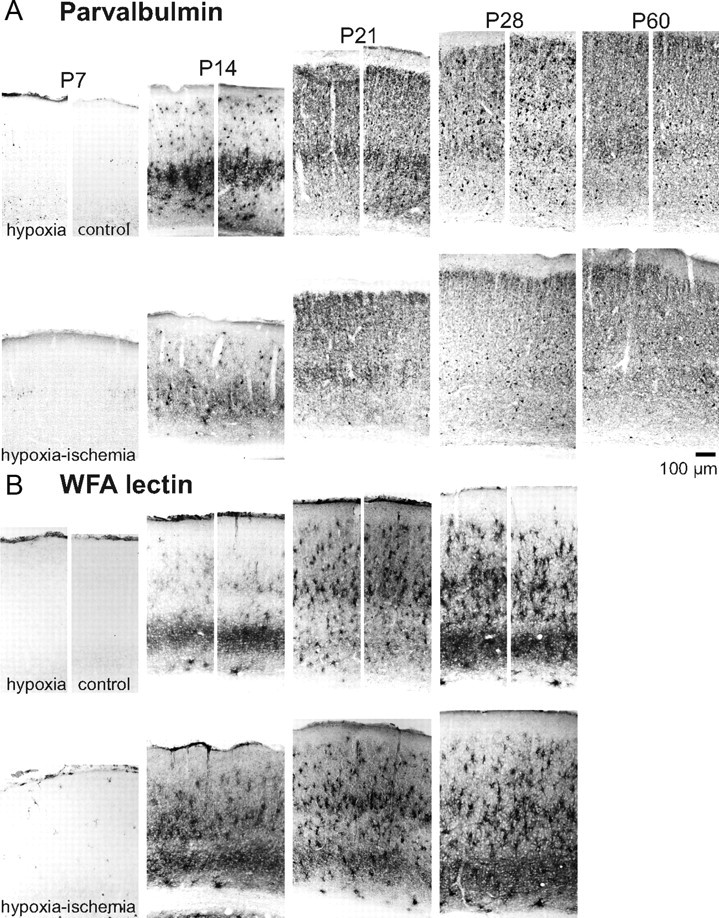
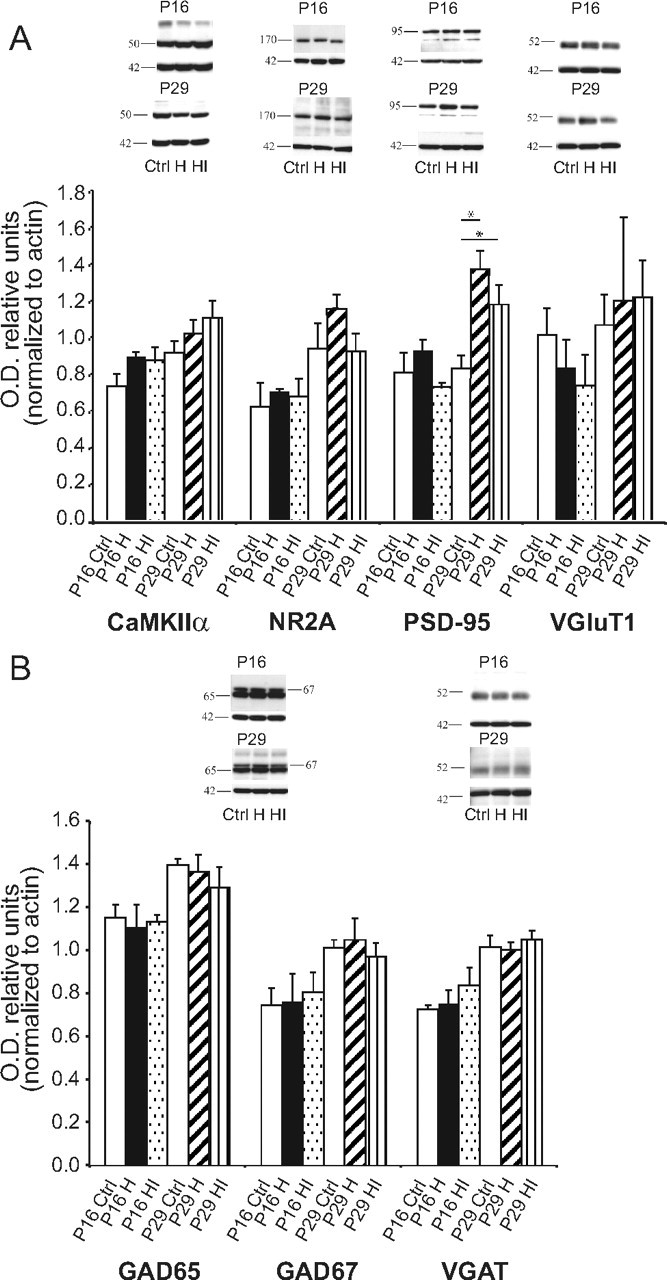
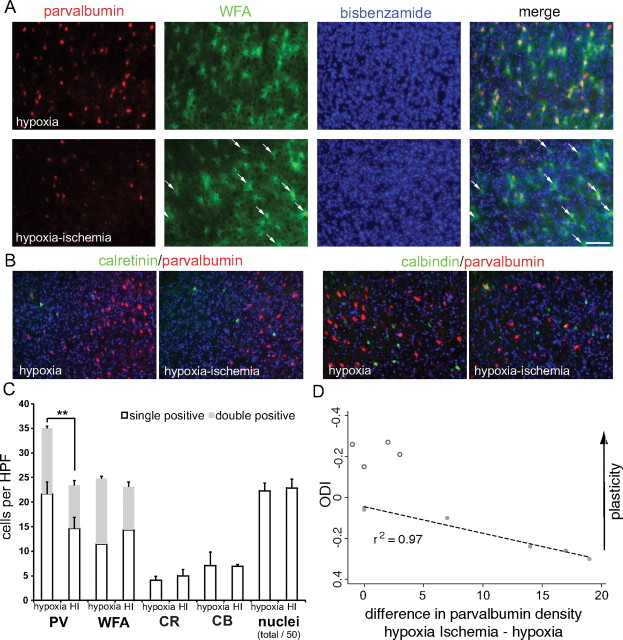
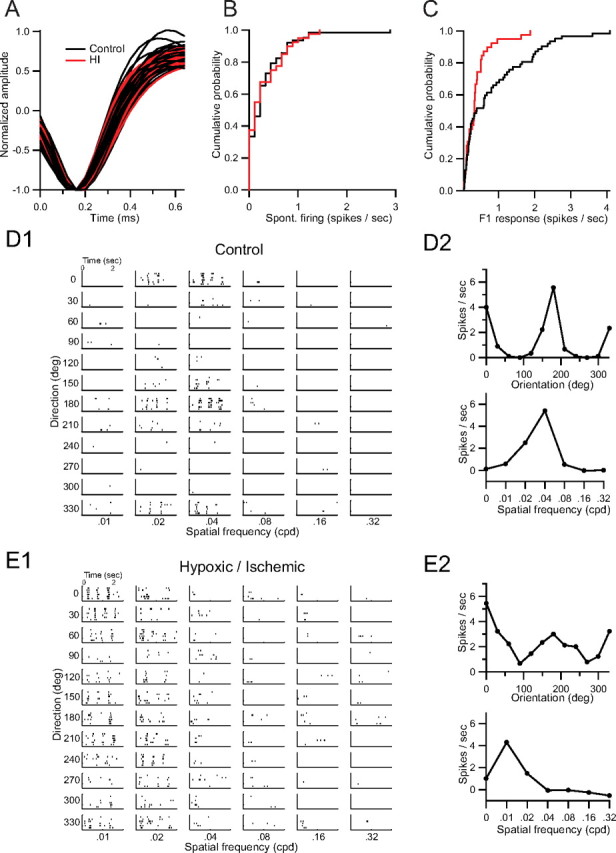
Ocular dominance plasticity (ODP) following monocular deprivation (MD) is a model of activity-dependent neural plasticity that is restricted to an early critical period regulated by maturation of inhibition. Unique developmental plasticity mechanisms may improve outcomes following early brain injury. Our objective was to determine the effects of neonatal cerebral hypoxia-ischemia (HI) on ODP. The rationale extends from observations that neonatal HI results in death of subplate neurons, a transient population known to influence development of inhibition. In rodents subjected to neonatal HI and controls, maps of visual response were derived from optical imaging during the critical period for ODP and changes in the balance of eye-specific response following MD were measured. In controls, MD results in a shift of the ocular dominance index (ODI) from a baseline of 0.15 to -0.10 (p < 0.001). Neonatal HI with moderate cortical injury impairs this shift, ODI = 0.14 (p < 0.01). Plasticity was intact in animals with mild injury and in those exposed to hypoxia alone. Neonatal HI resulted in decreased parvalbumin expression in hemispheres receiving HI compared with hypoxia alone: 23.4 versus 35.0 cells/high-power field (p = 0.01), with no change in other markers of inhibitory or excitatory neurons. Despite abnormal inhibitory neuron phenotype, spontaneous activity of single units and development of orientation selective responses were intact following neonatal HI, while overall visual responses were reduced. Our data suggest that specific plasticity mechanisms are impaired following early brain injury and that the impairment is associated with altered inhibitory neuronal development and cortical activation.


Figures

Figure 1.
Figure 1.
Categorical grade of injury. A–C, Diffusion-weighted MRI in the coronal plane at P3 and low-magnification images of cresyl violet stained coronal sections at the level of visual cortex at P32 following P2 HI demonstrate three grades of injury: mild (A), moderate (B), or severe (C). In the magnetic resonance images (top row) arrowheads indicate a hypointense band below neocortex in moderately injured animals (B). Severely injured animals show cortical hyperintensity (C, white asterisk). In severely injured animals, a cyst (black asterisk) may form laterally. D, Higher-magnification images from the boxed areas show specific injury to subplate and lower cortical layers with moderate to severe injury. V1, Primary visual cortex; SP, subplate.
Figure 2.
Figure 2.
Normal visual cortical map formation following neonatal HI with mild or moderate injury. A, Representative color-coded retinotopic phase maps and gray-scale response magnitude maps for control baseline (unmanipulated), HI-treated baseline, or control monocularly deprived animals demonstrate normal retinotopic organization and response in all conditions. The color-coded phase maps represent stimulation of the contralateral eye with a drifting vertically aligned bar (B). Each position in visual space (−30° to 30° elevation) is assigned a color value and the map of visual space is reproduced in primary visual cortex. The response maps represent the magnitude of response (darker = stronger) to stimulation of either the contralateral eye (middle column) or the ipsilateral eye (right column). C, Box plot summary (median, quartiles, and outliers) of response area across condition. D, E, Map scatter (a measure of map quality; larger values = worse maps) for elevation (D) or azimuth directions (E) across condition.
Figure 3.
Figure 3.
Neonatal HI with moderate cortical injury impairs ocular dominance plasticity. A, Strengthening (darker = stronger response) of the deprived eye (contralateral, right) and weakening of the undeprived eye (ipsilateral, left) are demonstrated by the response maps following MD in control animals. B, Neonatal HI prevents the shift in responsiveness induced by MD. C, The magnitude of ocular dominance plasticity is summarized as an ODI and represented across condition. Results are plotted on a reversed axis (up = more plasticity) for both urethane (circles) and pentobarbital (triangle) anesthesia regimens. The shaded area indicates the range of baseline ODI.
Figure 4.
Figure 4.
Summary of parvalbumin and perineuronal net development normally and following HI. A, Coronal images of representative parvalbumin immunohistochemistry at weekly postnatal intervals in control (unmanipulated), neonatal hypoxia-alone, and neonatal HI-treated neocortex. B, Coronal images of WFA lectin histochemistry at weekly postnatal intervals in control (unmanipulated), neonatal hypoxia-alone, and neonatal HI-treated neocortex.
Figure 5.
Figure 5.
Expression of excitatory or inhibitory markers following HI. A, Summary histograms (mean ± SEM) and representative immunoblot images for expression of markers of excitatory neurons (CaMKIIα, VGluT1), glutamatergic neurotransmission (NR2A, PSD-95), and actin loading control (42 kDa) in control (unmanipulated, white bars), neonatal hypoxia (black bar, P16; diagonal striped bar, P29), and neonatal HI (dotted bar, P16; horizontal striped bar, P29) exposed hemispheres 2 or 4 weeks postinjury. B, Summary histograms (mean ± SEM) and representative immunoblot images for expression of markers of inhibitory neurons and GABAergic neurotransmission (GAD65, GAD67, and VGAT) and actin loading control (42 kDa). *p < 0.05. No changes in these markers were specific to HI.
Figure 6.
Figure 6.
Loss of parvalbumin expression, not cell death. A, Single-channel parvalbumin (red), WFA (green), bisbenzamide (blue), and merged images of combined immunofluorescence in hypoxia- or HI-treated hemispheres. Increased numbers of single-positive WFA stained cells (arrows), despite maintenance of total (single- plus double-positive) WFA numbers, are shown in the HI hemisphere. B, Merged images from both hypoxia- and HI-treated hemispheres of parvalbumin (red), bisbenzamide (blue), and calretinin (green, left) or calbindin (green, right). C, Quantification of single-positive (white bars) and double-positive (gray bars) cell densities in hypoxia- or HI-treated hemispheres. D, Scatter plot of the ocular dominance index (y axis, reverse scale: increased plasticity = up) versus the between-hemisphere difference (hypoxia, HI, x axis) in parvalbumin cell density (closed circles = moderate injury, open circles = mild injury). **p < 0.01. Data plotted are from individual animals presented in A.
Figure 7.
Figure 7.
A, Aligned spike waveforms from control (black) and HI-treated (red) animals. B, Cumulative probability distribution of average spontaneous firing occurring during presentation of a blank stimulus. C, Cumulative probability distribution of peak firing rates in response to a contrast-modulated noise movie. D1, D2, Rasters (D1) and orientation and spatial frequency selectivity (D2) of a tuned, selective cell from a control animal. E1, E2, Rasters (E1) and orientation and spatial frequency selectivity (E2) of a tuned, selective cell from an HI-treated animal.

Similar articles

Cited by

References

    1. Akerman CJ, Cline HT. Refining the roles of GABAergic signaling during neural circuit formation. Trends Neurosci. 2007;30:382–389. - PubMed
    1. Allendoerfer KL, Shatz CJ. The subplate, a transient neocortical structure: its role in the development of connections between thalamus and cortex. Annu Rev Neurosci. 1994;17:185–218. - PubMed
    1. Alpár A, Gärtner U, Härtig W, Brückner G. Distribution of pyramidal cells associated with perineuronal nets in the neocortex of rat. Brain Res. 2006;1120:13–22. - PubMed
    1. Antonini A, Fagiolini M, Stryker MP. Anatomical correlates of functional plasticity in mouse visual cortex. J Neurosci. 1999;19:4388–4406. - PMC - PubMed
    1. Arumugam H, Liu X, Colombo PJ, Corriveau RA, Belousov AB. NMDA receptors regulate developmental gap junction uncoupling via CREB signaling. Nat Neurosci. 2005;8:1720–1726. - PubMed

Publication types

LinkOut - more resources