Comparative Study
. 2010 Jan 6;30(1):148-60.
doi: 10.1523/JNEUROSCI.3862-09.2010.

Mechanisms of spatial attention control in frontal and parietal cortex

Affiliations
Comparative Study

Mechanisms of spatial attention control in frontal and parietal cortex

Sara M Szczepanski et al. J Neurosci. .

Abstract

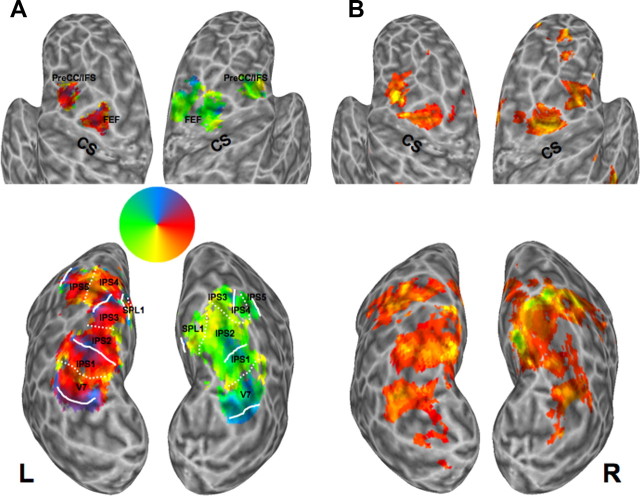
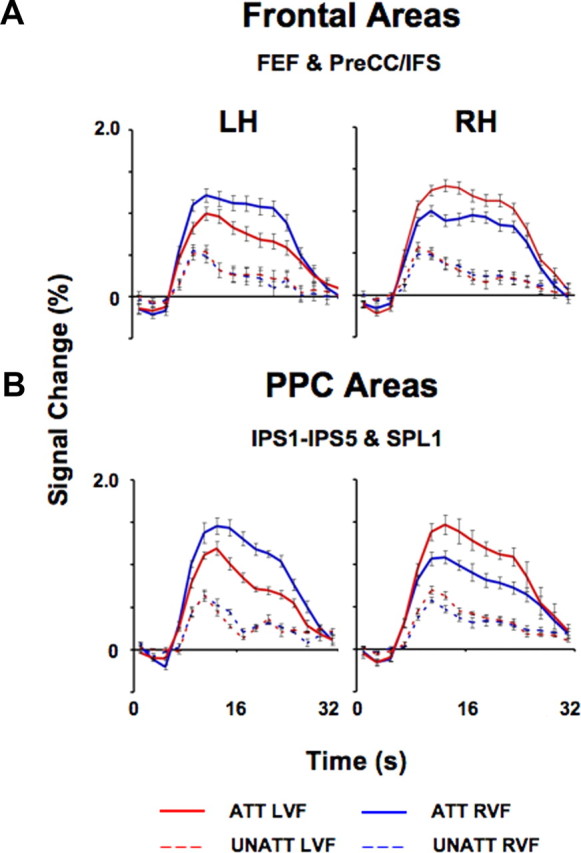
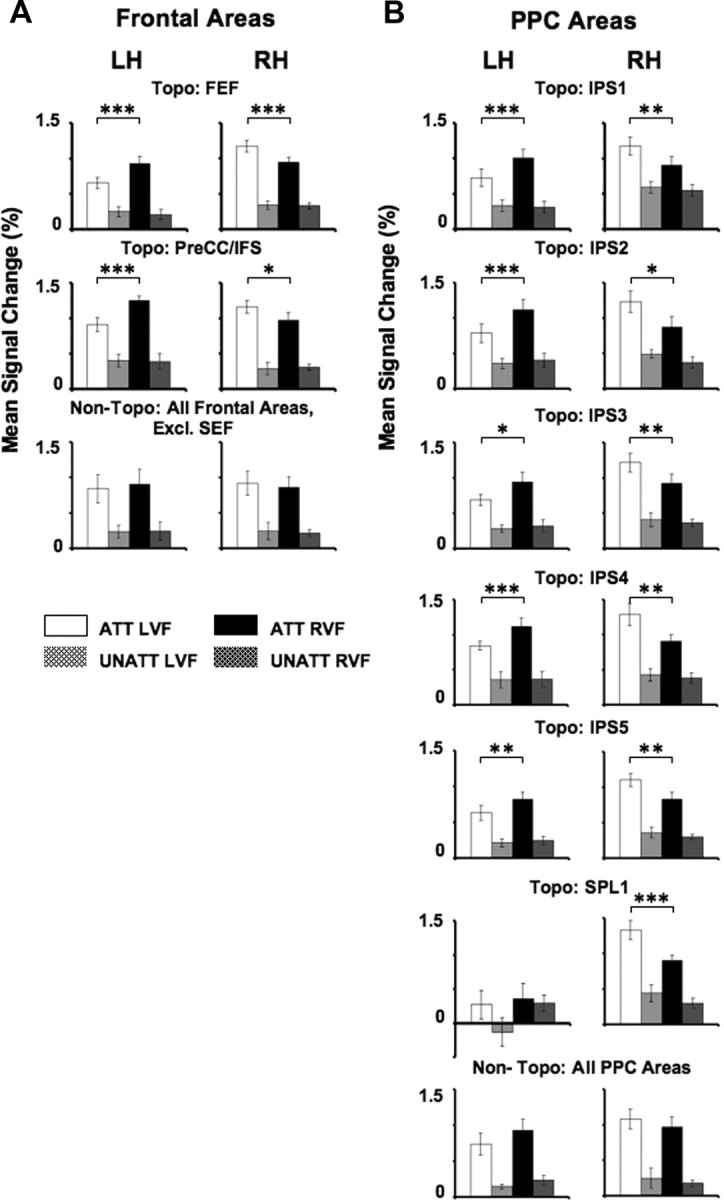
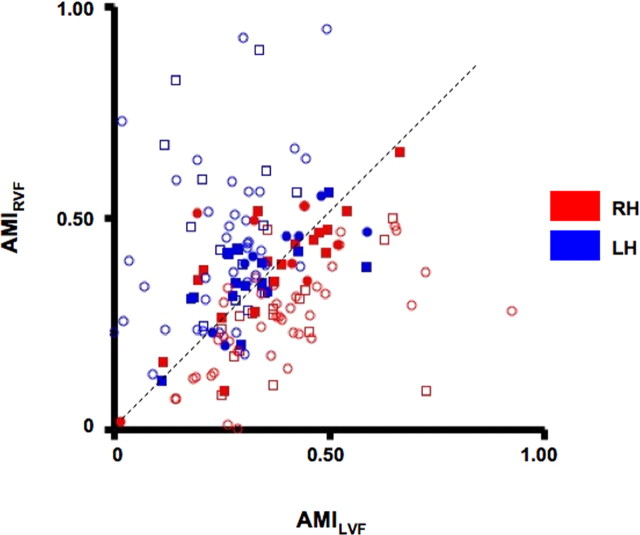
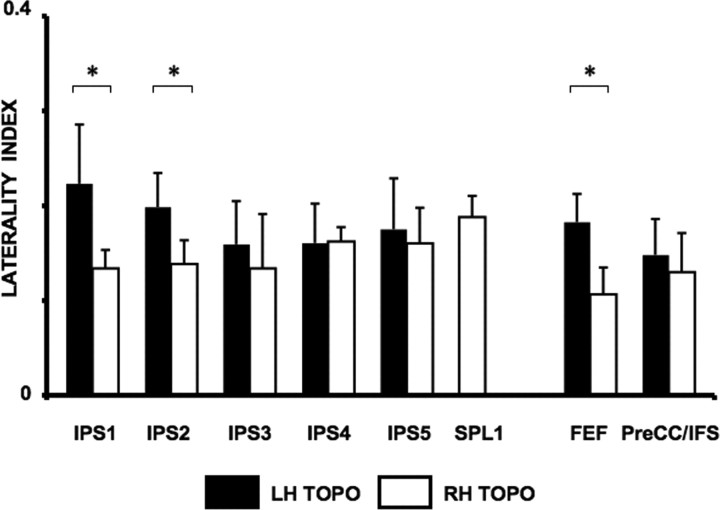
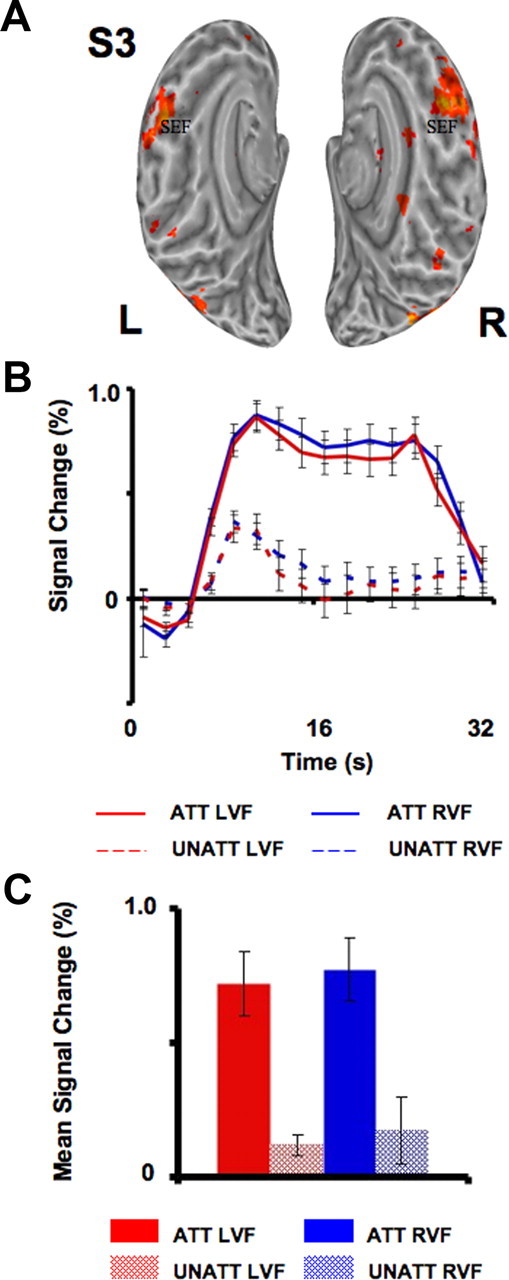
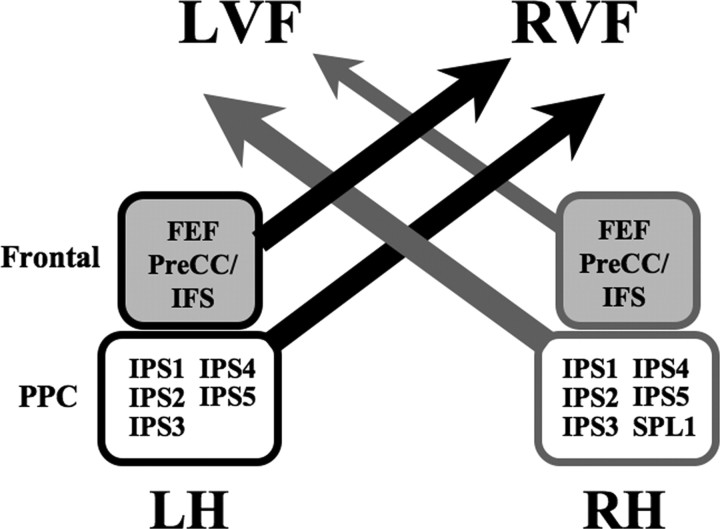
Theories of spatial attentional control have been largely based upon studies of patients suffering from visuospatial neglect, resulting from circumscribed lesions of frontal and posterior parietal cortex. In the intact brain, the control of spatial attention has been related to a distributed frontoparietal attention network. Little is known about the nature of the control mechanisms exerted by this network. Here, we used a novel region-of-interest approach to relate activations of the attention network to recently described topographic areas in frontal cortex [frontal eye field (FEF), PreCC/IFS (precentral cortex/inferior frontal sulcus)] and parietal cortex [intraparietal sulcus areas (IPS1-IPS5) and an area in the superior parietal lobule (SPL1)] to examine their spatial attention signals. We found that attention signals in most topographic areas were spatially specific, with stronger responses when attention was directed to the contralateral than to the ipsilateral visual field. Importantly, two hemispheric asymmetries were found. First, a region in only right, but not left SPL1 carried spatial attention signals. Second, left FEF and left posterior parietal cortex (IPS1/2) generated stronger contralateral biasing signals than their counterparts in the right hemisphere. These findings are the first to characterize spatial attention signals in topographic frontal and parietal cortex and provide a neural basis in support of an interhemispheric competition account of spatial attentional control.


Figures

Figure 1.
Figure 1.
Experimental design. Visual stimuli were presented in one of the four quadrants at a peripheral location and probed under two conditions: attended and unattended. A schematic outline of one scan run is shown. In the unattended condition (frame #2), subjects performed a demanding letter-counting task at fixation, counting the number of target letters among distracters, while ignoring the peripheral stimuli. In the attended condition (frame #5), subjects were instructed by a brief occurrence of a cue at fixation (frame #4) to covertly direct attention to one of the four peripheral locations and to count the occurrences of a target stimulus in the location closest to fixation. Attended and unattended presentations were interleaved with blank fixation periods (frames #1, #3, and #6) during which subjects performed the letter-counting task. Blocks of attended and unattended presentations alternated with blank periods.
Figure 2.
Figure 2.
Topographic areas in frontal and parietal cortex and the frontoparietal attention network. Activations projected onto an inflated surface of the subject's brain within frontal (top) and parietal cortex (bottom) from a representative subject (S9). A, Topographic maps were obtained using the memory-guided saccade task. The color legend is shown (middle) for voxels whose responses were correlated with the fundamental frequency of the remembered location, indicating the phase of the response. The visual field color legend labels the saccade direction/memorized location within the visual field to the voxel that is most responsive. Boundaries between PPC areas are outlined in white; continuous lines denote the upper vertical meridian, broken lines denote the lower vertical meridian. Topographic areas within frontal cortex (FEF, PreCC/IFS) and PPC (IPS1–IPS5, SPL1) are labeled. B, The frontoparietal spatial attention network was defined based on the contrast “attend to the periphery” versus “attend to fixation” (p < 0.001). A significant overlap of voxels activated in the spatial attention task with topographic frontal and parietal areas is immediately obvious. CS, Central sulcus.
Figure 3.
Figure 3.
Spatial specificity of attention-related activations. A, B, Voxels within frontal cortex (A) and parietal cortex (B) were separated according to memory-guided saccade phase, to the upper left (UL), lower left (LL), upper right (UR), or lower right (LR) visual field. The average pairwise correlation was then computed between spatial attention time series of voxels within the same ROI or between time series of voxels within different ROIs. Each graph represents the correlation values averaged across subjects in a group correlation matrix.
Figure 4.
Figure 4.
Time series of fMRI attention signals in topographic regions of frontal and parietal cortex. A, B, Spatial attention signals averaged across subjects in topographic regions of frontal (A; n = 9) and parietal cortex (B; n = 8) are shown separately for each hemisphere. Data were averaged across all topographic frontal (FEF, PreCC/IFS; A) and parietal voxels (IPS1–IPS5, SPL1; B) that were activated by a spatial attention task (attended vs unattended contrast). Solid curves indicate activity evoked by the attended conditions (ATT) and dashed curves indicate activity evoked by the unattended (UNATT) conditions. Red curves correspond to directed attention to the LVF, while blue curves correspond to directed attention to the RVF. Error bars indicate SEM across subjects.
Figure 5.
Figure 5.
Mean signal changes in frontal and parietal areas. A, B, Mean signal changes obtained during the spatial attention task averaged across subjects are shown for areas within frontal (A) and parietal cortex (B). For each subject, mean signal change was defined as the average of the eight peak intensities of the fMRI signal obtained during each condition. Mean signals are shown separately for each hemisphere and for different ROIs: voxels activated by the spatial attention task (attended vs unattended contrast) that were assigned to topographic areas (Topo) and those that did not overlap with topographic areas (Non-Topo). Mean responses of activations assigned to topographic areas in frontal (FEF and PreCC/IFS) and parietal cortex (IPS1–IPS5, SPL1) are shown separately for each area. Responses were averaged across all frontal and parietal voxels that responded to the spatial attention task but were not topographically organized, with the exception of the SEF. Solid bars indicate activity evoked by the attended conditions (ATT) and hatched bars indicate activity evoked by the unattended (UNATT) conditions. White bars correspond to directed attention to the LVF, while black bars correspond to directed attention to the RVF. Error bars indicate SEM across subjects. *p < 0.05; **p < 0.01; ***p < 0.001.
Figure 6.
Figure 6.
Attention Modulation Index. Each point of the graph represents a single subject's AMI value for a given ROI that was calculated based on mean signal changes obtained from voxels activated during the spatial attention task (attended vs unattended contrast). Data are shown separately for topographically organized ROIs (open symbols) within frontal (FEF and PreCC/IFS; squares) and parietal cortex (IPS1–IPS5, SPL1, excluding left SPL1; circles), as well as non-topographically organized ROIs (closed symbols) within frontal and parietal cortex. Two AMIs were calculated for each ROI reflecting attentional modulation when subjects attended to the RVF (AMIRVF) or to the LVF (AMILVF) and are plotted against one another. Blue symbols represent LH ROIs and red symbols represent RH ROIs. For AMI definitions, see Materials and Methods.
Figure 7.
Figure 7.
Laterality Index. LIs for each topographic ROI and hemisphere were calculated based on mean signal changes obtained from voxels activated during the spatial attention task (attended vs unattended contrast). LI values are shown separately for each hemisphere and for each topographic ROI, averaged across subjects. Black bars correspond to LH ROIs, white bars correspond to RH ROIs. Error bars indicate SEM across subjects. *p < 0.05. For LI definitions, see Materials and Methods.
Figure 8.
Figure 8.
Attention signals in SEF. A, An example from one subject (S3) illustrates the extent of the activations found with the spatial attention task in human SEF (attended vs unattended, p < 0.001). B, C, fMRI signals (B) and mean signal changes (C) obtained in SEF averaged across all subjects (n = 9) during attended conditions (solid lines/bars) and unattended conditions (dashed lines/hatched bars) are also shown. For each subject, mean signal change was defined as the average of the eight peak intensities of the fMRI signal obtained during each condition. Red lines/bars indicate activity evoked by stimuli that appeared within the LVF, while blue lines/bars indicate activity evoked by stimuli within the RVF. Error bars indicate SEM across subjects.
Figure 9.
Figure 9.
Model of visuospatial attention. A new model of visuospatial attention control is proposed, in which a number of topographically organized areas in frontoparietal cortex bias attention to the contralateral visual field. Arrows toward the RVF or LVF denote the direction of attentional bias for each lobe (frontal cortex or PPC), while the thickness of each arrow refers to the strength of the attentional bias, or attentional weight. For example, left FEF and PreCC/IFS together exert a stronger contralateral bias toward the RVF than their RH counterparts exert toward the LVF. Gray nodes correspond to topographically organized areas within the RH, while black nodes correspond to those in the LH. Shaded nodes are located in frontal cortex, while nonshaded nodes are located in PPC.

Similar articles

Cited by

References

    1. Bandettini PA, Jesmanowicz A, Wong EC, Hyde JS. Processing strategies for time-course data sets in functional MRI of the human brain. Magn Reson Med. 1993;30:161–173. - PubMed
    1. Bartolomeo P, Chokron S, Gainotti G. Laterally directed arm movements and right unilateral neglect after left hemisphere damage. Neuropsychologia. 2001;39:1013–1021. - PubMed
    1. Beis JM, Keller C, Morin N, Bartolomeo P, Bernati T, Chokron S, Leclercq M, Louis-Dreyfus A, Marchal F, Martin Y, Perennou D, Pradat-Diehl P, Prairial C, Rode G, Rousseaux M, Samuel C, Sieroff E, Wiart L, Azouvi P. Right spatial neglect after left hemisphere stroke: qualitative and quantitative study. Neurology. 2004;63:1600–1605. - PubMed
    1. Bon L, Lucchetti C. Attention-related neurons in the supplementary eye field of the macaque monkey. Exp Brain Res. 1997;113:180–185. - PubMed
    1. Brainard DH. The Psychophysics Toolbox. Spat Vis. 1997;10:433–436. - PubMed

Publication types

LinkOut - more resources