Comparative Study
. 2010 Jan 6;30(1):316-24.
doi: 10.1523/JNEUROSCI.4974-09.2010.

Metabotropic glutamate receptor-mediated cell signaling pathways are altered in a mouse model of Huntington's disease

Affiliations
Comparative Study

Metabotropic glutamate receptor-mediated cell signaling pathways are altered in a mouse model of Huntington's disease

Fabiola M Ribeiro et al. J Neurosci. .

Abstract

Huntington's disease (HD) is an autosomal-dominant neurodegenerative disorder caused by a polyglutamine expansion in the huntingtin protein (Htt). Group I metabotropic glutamate receptors (mGluRs) are coupled to G(alphaq) and play an important role in neuronal survival. We have previously demonstrated that mGluRs interact with Htt. Here we used striatal neuronal primary cultures and acute striatal slices to demonstrate that mGluR-mediated signaling pathways are altered in a presymptomatic mouse model of HD (Hdh(Q111/Q111)), as compared to those of control mice (Hdh(Q20/Q20)). mGluR1/5-mediated inositol phosphate (InsP) formation is desensitized in striatal slices from Hdh(Q111/Q111) mice and this desensitization is PKC-mediated. Despite of decreased InsP formation, (S)-3,5-dihydroxylphenylglycine (DHPG)-mediated Ca(2+) release is higher in Hdh(Q111/Q111) than in Hdh(Q20/Q20) neurons. Furthermore, mGluR1/5-stimulated AKT and extracellular signal-regulated kinase (ERK) activation is altered in Hdh(Q111/Q111) mice. Basal AKT activation is higher in Hdh(Q111/Q111) neurons and this increase is mGluR5 dependent. Moreover, mGluR5 activation leads to higher levels of ERK activation in Hdh(Q111/Q111) than in Hdh(Q20/Q20) striatum. PKC inhibition not only brings Hdh(Q111/Q111) DHPG-stimulated InsP formation to Hdh(Q20/Q20) levels, but also causes an increase in neuronal cell death in Hdh(Q111/Q111) neurons. However, PKC inhibition does not modify neuronal cell death in Hdh(Q20/Q20) neurons, suggesting that PKC-mediated desensitization of mGluR1/5 in Hdh(Q111/Q111) mice might be protective in HD. Together, these data indicate that group I mGluR-mediated signaling pathways are altered in HD and that these cell signaling adaptations could be important for striatal neurons survival.


Figures

Figure 1.
Figure 1.
DHPG-stimulated InsP formation is decreased in HdhQ111/Q111 mice. A, Shown is mGluR1/5-stimulated inositol phosphate formation in response to either 5 or 50 μm DHPG for 15 min at 37°C in striatal slices from either mGluR5−/− or wild-type mice. Data represent the means ± SEM of three independent experiments, expressed as percentage of DHPG-stimulated wild-type slice maximum response. Asterisks indicate significant differences as compared to wild-type slices at the corresponding agonist concentration (p < 0.05). B, Shown is DHPG-stimulated inositol phosphate formation in striatal neurons stimulated with increasing concentrations of agonist for 5 min at 37°C. The data points represent the means ± SEM of five independent experiments, expressed as percentage of HdhQ20/Q20 maximum DHPG-stimulated response. C, Shown is mGluR1/5-stimulated inositol phosphate formation in response to either 5 or 50 μm DHPG for 15 min at 37°C in striatal slices from either HdhQ20/Q20 or HdhQ111/Q111 mice. Data represent the means ± SEM of five independent experiments, expressed as percentage of DHPG-stimulated HdhQ20/Q20 slice maximum response. Asterisks indicate significant differences as compared to HdhQ20/Q20 slices at the corresponding agonist concentration (p < 0.05).
Figure 2.
Figure 2.
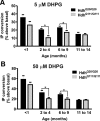
The decrease in HdhQ111/Q111 InsP formation is only present in presymptomatic huntingtin mice. Shown is mGluR1/5-stimulated inositol phosphate formation in response to either 5 μm (A) or 50 μm (B) DHPG for 15 min at 37°C in striatal slices from either HdhQ20/Q20 or HdhQ111/Q111 mice from different age groups. Asterisks indicate significant differences as compared to HdhQ20/Q20 slices at the corresponding age group (p < 0.05).
Figure 3.
Figure 3.
Agonist-stimulated Ca2+ release is higher in HdhQ111/Q111 than in HdhQ20/Q20 neurons. A, B, Graphs show intracellular concentration of Ca2+ in HdhQ20/Q20 and HdhQ111/Q111 striatal neurons stimulated with either 10 μm DHPG (A) or 100 μm carbachol (B) for 20 s (indicated by the bar). C, Graph shows the area under the curve (AUC) of the integrated Ca2+ responses to agonist stimulation in HdhQ20/Q20 and HdhQ111/Q111 neurons. D, Graph shows the amplitude of agonist-stimulated Ca2+ transients quantified as the maximal rise of [Ca2+]i above basal levels in HdhQ20/Q20 and HdhQ111/Q111 neurons. Data represent the means ± SEM of five independent experiments and a total of 80 cells analyzed. Asterisks indicate significant differences as compared to HdhQ20/Q20 response (p < 0.05).
Figure 4.
Figure 4.
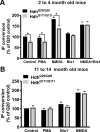
The decrease in InsP formation in HdhQ111/Q111 mice is PKC dependent. A, B, Shown is mGluR1/5-stimulated inositol phosphate formation in response to 50 μm DHPG for 15 min at 37°C in striatal slices from either HdhQ20/Q20 or HdhQ111/Q111 mice that were 2–4 (A) or 11–14 months old (B). Vehicle alone or vehicle plus indicated drug [PMA, NMDA, bisindolylmaleimide I (Bis1), or NMDA+Bis1] were added to slices 15 min before DHPG stimulation. Data represent the means ± SEM of six independent experiments, expressed as percentage of DHPG-stimulated HdhQ20/Q20 slices (control). Asterisks indicate significant differences as compared to matched treated HdhQ20/Q20 slices (p < 0.05).
Figure 5.
Figure 5.
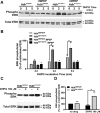
mGluR5-stimulated ERK1/2 phosphorylation is more elevated in HdhQ111/Q111 than in HdhQ20/Q20 mice. A, Shown is a representative immunoblot for phospho- (upper panel) and total-ERK expression (lower panel) in primary cultured striatal neurons from either HdhQ20/Q20 or HdhQ111/Q111 mice stimulated with 10 μm DHPG for 0, 2, or 5 min in presence or absence of 10 μm MPEP. 50 μg of cell lysate is used for each sample. B, Graph shows the densitometric analysis of phospho-ERK normalized to total-ERK expression in primary cultured striatal neurons. Data represent the mean ± SEM of six independent experiments, expressed as percentage of basal ERK phosphorylation in HdhQ20/Q20 neurons. Asterisks indicate significant differences as compared to matched treated HdhQ20/Q20 neurons (p < 0.05). # indicates significant difference as compared to basal ERK1/2 phosphorylation levels (p < 0.05). C, Shown is a representative immunoblot for phospho- (upper panel) and total-ERK expression (lower panel) in striatal slices from either HdhQ20/Q20 or HdhQ111/Q111 mice stimulated with 100 μm DHPG for 30 min. 100 μg of cell lysate is used for each sample. D, Graph shows the densitometric analysis of phospho-ERK normalized to total-ERK expression in striatal slices. Data represent the mean ± SEM of five independent experiments, expressed as percentage of basal ERK phosphorylation in HdhQ20/Q20 slices. Asterisk indicates significant difference as compared to matched treated HdhQ20/Q20 slices (p < 0.05).
Figure 6.
Figure 6.
mGluR5-dependent basal AKT phosphorylation is higher in HdhQ111/Q111 than in HdhQ20/Q20 neurons. A, Shown is a representative immunoblot for phospho- (upper panel) and total-AKT expression (lower panel) in primary cultured striatal neurons from either HdhQ20/Q20 or HdhQ111/Q111 mice stimulated with 10 μm DHPG for 0, 2, or 5 min in presence or absence of 10 μm MPEP. 50 μg of cell lysate is used for each sample. B, Graph shows the densitometric analysis of phospho-AKT normalized to total-AKT expression in primary cultured striatal neurons. Data represent the mean ± SEM of six independent experiments, expressed as percentage of basal AKT phosphorylation in HdhQ20/Q20 neurons. Asterisks indicate significant differences as compared to matched treated HdhQ20/Q20 neurons (p < 0.05).
Figure 7.
Figure 7.
Inhibition of PKC-mediated mGluR5 desensitization causes an increase in cell death. Graph shows percentage of drug-induced cell death in striatal neurons from HdhQ20/Q20/mGluR5+/+, HdhQ111/Q111/mGluR5+/+ or HdhQ111/Q111/mGluR5−/− mice. Striatal neuronal cultures were incubated with 250 μm glutamate, 100 μm DHPG, 1 μm Bis1 or 100 μm DHPG +1 μm Bis1 for 24 h. Data represent the means ± SEM of six to seven independent experiments. Asterisks indicate significant difference in HdhQ111/Q111/mGluR5+/+ cell death as compared to HdhQ20/Q20/mGluR5+/+ and HdhQ111/Q111/mGluR5−/− neuronal cell death (p < 0.05).
Figure 8.
Figure 8.
Schematic representation of the proposed model for mGluR1/5 signaling alterations in HD. Shown is a schematic for mGluR1/5 signaling in HdhQ20/Q20 and HdhQ111/Q111 mice. mGluR1/5 are coupled to Gαq/11 proteins, and its activation results in diacylglycerol (DAG) and IP3 formation, release of Ca2+ from intracellular stores and activation of PKC, as well as activation of ERK and AKT. In HdhQ111/Q111 mice, mGluR1/5-mediated IP3 formation is decreased due to increased PKC-mediated mGluR1/5 desensitization. Despite of decreased InsP formation, mGluR1/5-mediated calcium release, as well as ERK and AKT activation are increased in HdhQ111/Q111 mice, as compared to HdhQ20/Q20 mice. This is likely the consequence of an adaptive response in an attempt to keep HdhQ111/Q111 neurons alive in the presymptomatic phase of the disease. Inhibition of PKC leads to increased DHPG-stimulated cell death in neurons derived from HdhQ111/Q111 mice, as compared to HdhQ20/Q20 mice.

Similar articles

Cited by

References

    1. Alagarsamy S, Marino MJ, Rouse ST, Gereau RW, 4th, Heinemann SF, Conn PJ. Activation of NMDA receptors reverses desensitization of mGluR5 in native and recombinant systems. Nat Neurosci. 1999;2:234–240. - PubMed
    1. Alagarsamy S, Saugstad J, Warren L, Mansuy IM, Gereau RW, 4th, Conn PJ. NMDA-induced potentiation of mGluR5 is mediated by activation of protein phosphatase 2B/calcineurin. Neuropharmacology. 2005;49(Suppl 1):135–145. - PMC - PubMed
    1. Anborgh PH, Godin C, Pampillo M, Dhami GK, Dale LB, Cregan SP, Truant R, Ferguson SS. Inhibition of metabotropic glutamate receptor signaling by the huntingtin-binding protein optineurin. J Biol Chem. 2005;280:34840–34848. - PubMed
    1. Baskys A, Bayazitov I, Fang L, Blaabjerg M, Poulsen FR, Zimmer J. Group I metabotropic glutamate receptors reduce excitotoxic injury and may facilitate neurogenesis. Neuropharmacology. 2005;49(Suppl 1):146–156. - PubMed
    1. Beal MF, Ferrante RJ, Swartz KJ, Kowall NW. Chronic quinolic acid lesions in rats closely resemble Huntington's disease. J Neurosci. 1991;11:1649–1659. - PMC - PubMed

Publication types

Substances