Comparative Study
. 2010 Jan 6;30(1):331-41.
doi: 10.1523/JNEUROSCI.4554-09.2010.

Normal hearing is required for the emergence of long-lasting inhibitory potentiation in cortex

Affiliations
Comparative Study

Normal hearing is required for the emergence of long-lasting inhibitory potentiation in cortex

Han Xu et al. J Neurosci. .

Abstract

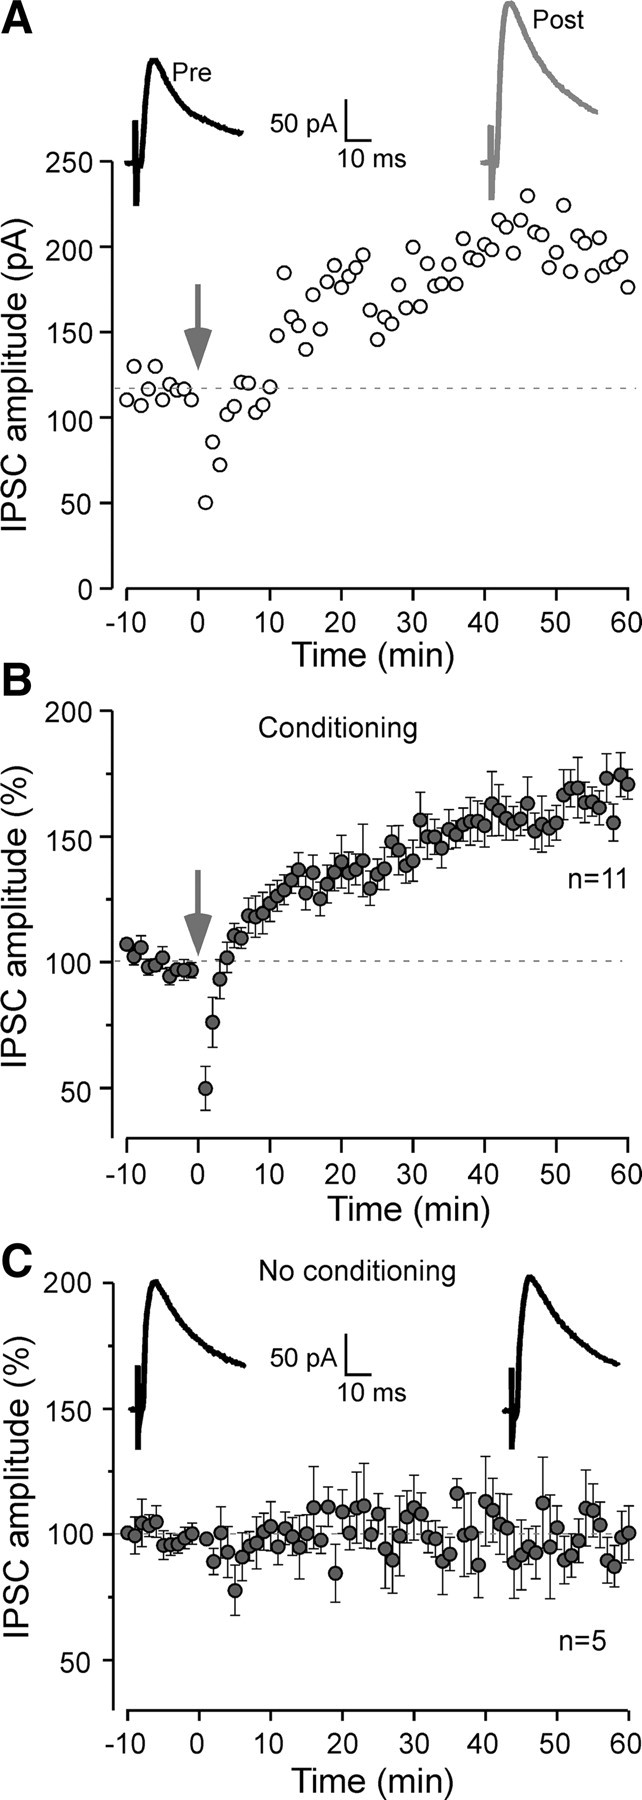
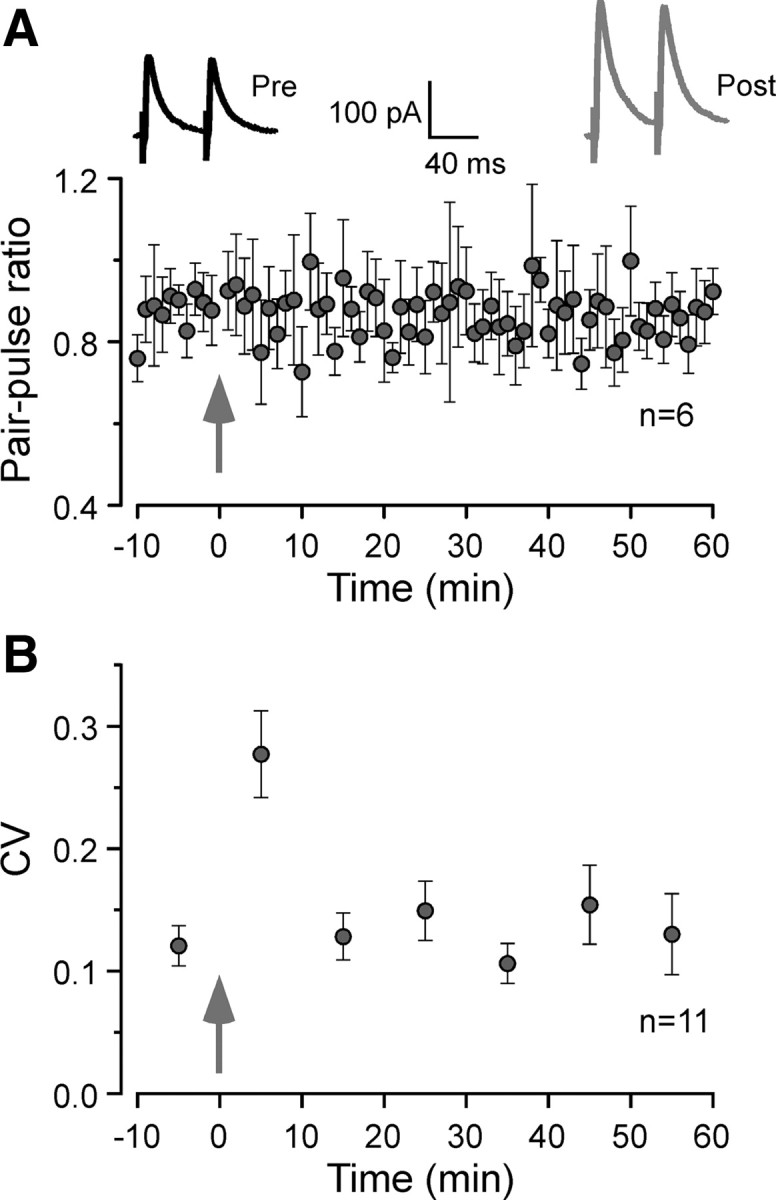
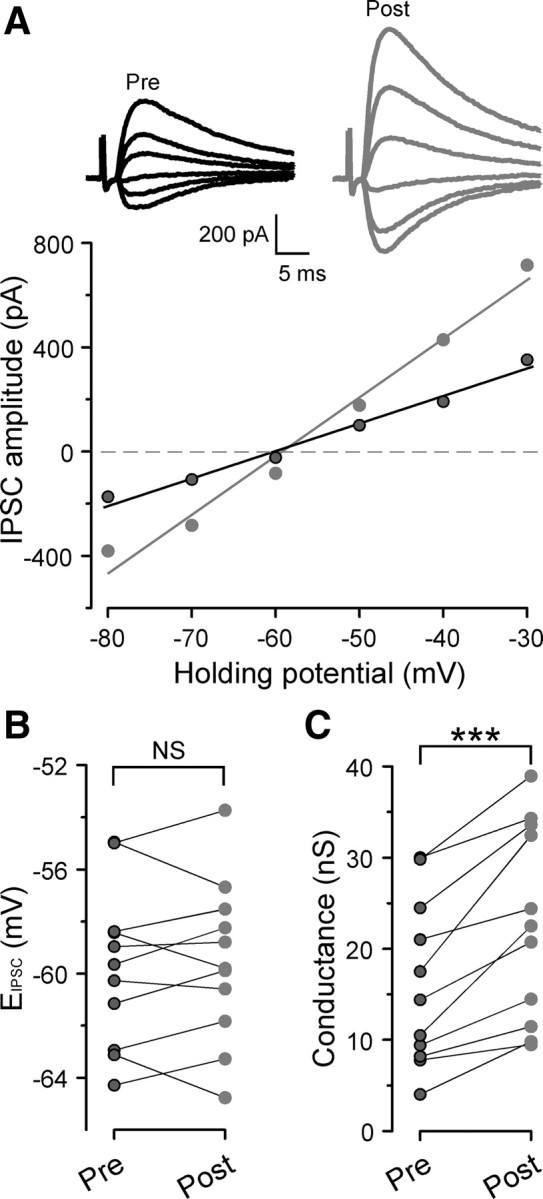
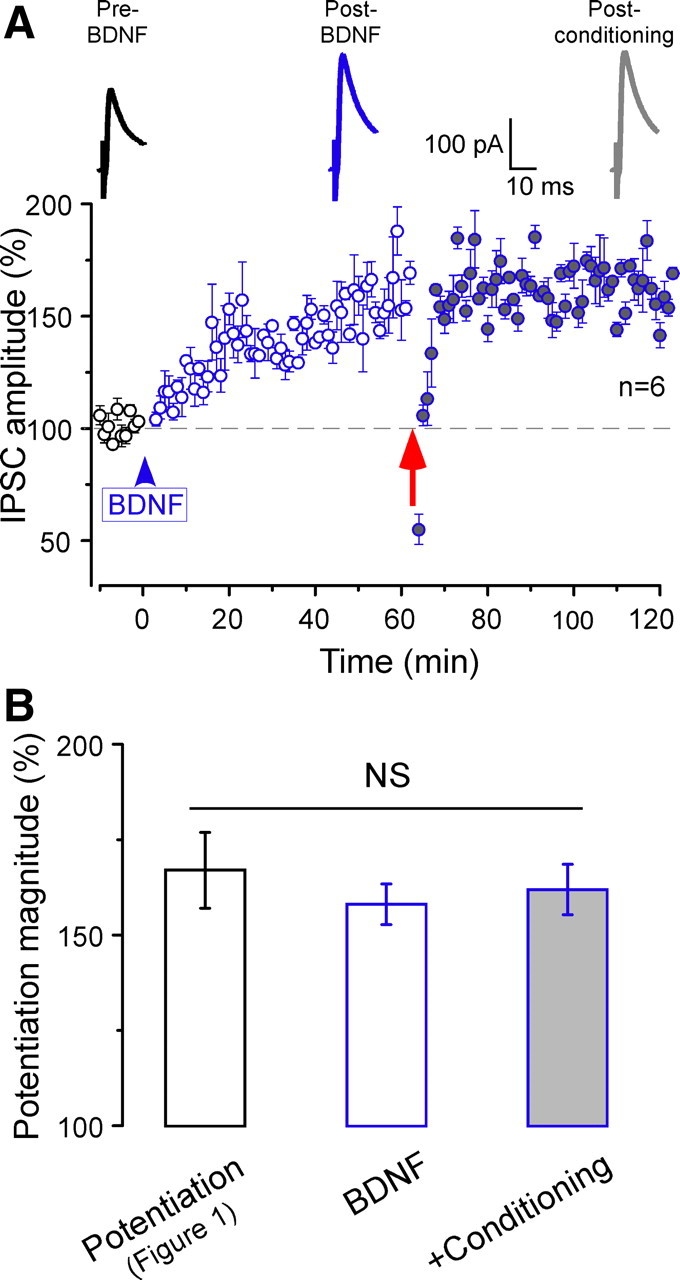
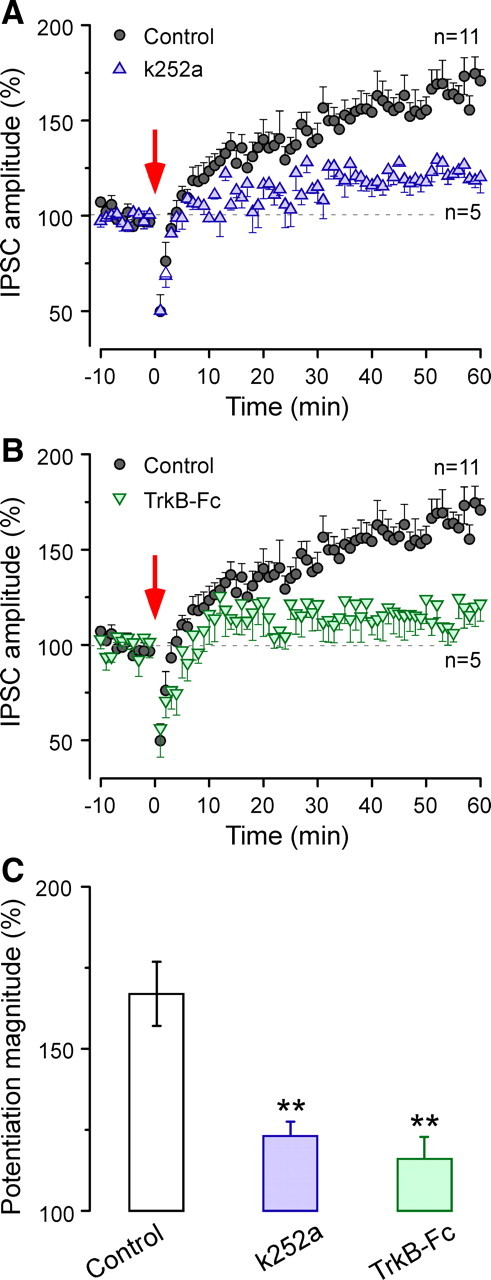
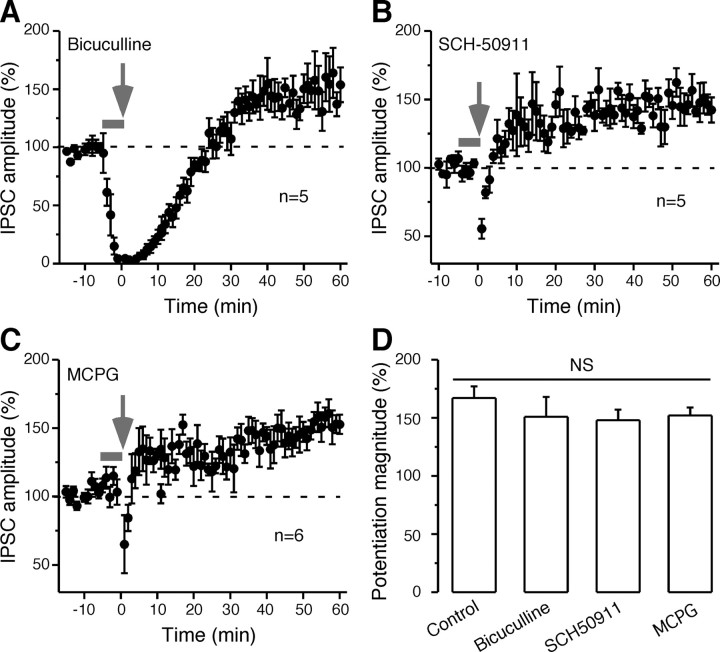
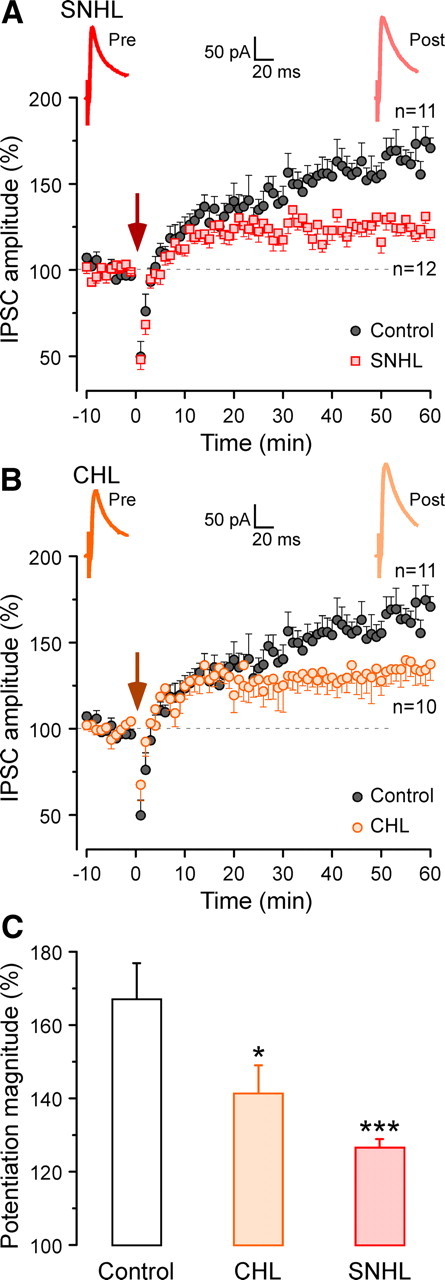
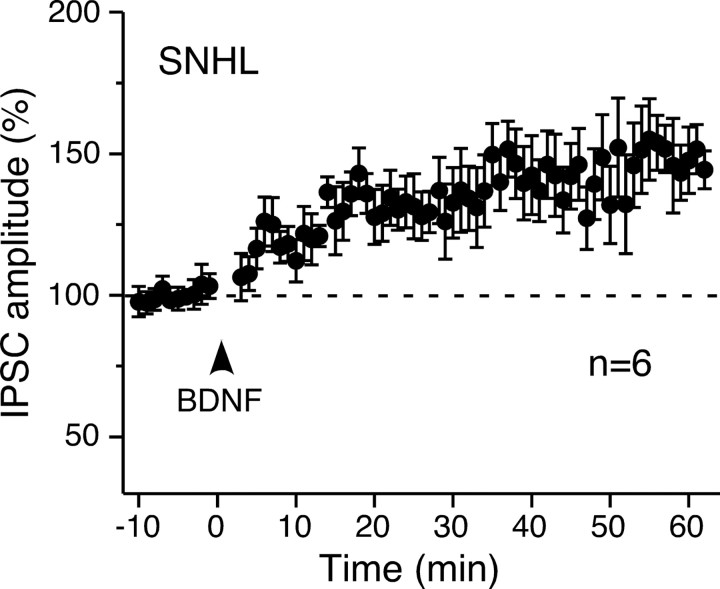
Long-term synaptic plasticity is a putative mechanism for learning in adults. However, there is little understanding of how synaptic plasticity mechanisms develop or whether their maturation depends on experience. Since inhibitory synapses are particularly malleable to sensory stimulation, long-lasting potentiation of inhibitory synapses was characterized in auditory thalamocortical slices. Intracortical high-frequency electrical stimulation led to a 67% increase in inhibitory synaptic currents. In the absence of stimulation, inhibitory potentiation was induced by a brief exposure to exogenous brain-derived neurotrophic factor (BDNF). BDNF exposure occluded any additional potentiation by high-frequency afferent stimulation, suggesting that BDNF signaling is sufficient to account for inhibitory potentiation. Moreover, inhibitory potentiation was reduced significantly by extracellular application of a BDNF scavenger or by intracellular blockade of BDNF receptor [tropomyosin-related kinase B (TrkB)] signaling. In contrast, glutamatergic or GABAergic antagonists did not prevent the induction of inhibitory potentiation. Since BDNF and TrkB expression are influenced strongly by activity, we predicted that inhibitory potentiation would be diminished by manipulations that decrease central auditory activity, such as hearing loss. Two forms of hearing loss were examined: conductive hearing loss in which the cochleae are not damaged or sensorineural hearing loss in which both cochleae are removed. Both forms of hearing loss were found to reduce significantly the magnitude of inhibitory potentiation. These data indicate that early experience is necessary for the normal development of BDNF-mediated long-lasting inhibitory potentiation, which may be associated with perceptual deficits at later ages.


Figures

Figure 1.
Figure 1.
Long-lasting inhibitory potentiation in the auditory cortex. A, Representative L4-evoked IPSCs of a L2/3 pyramidal neuron before and after conditioning (arrow) at a holding potential of −45 mV. Data points represent the peak IPSC amplitude. The dashed line represents preconditioning baseline IPSC amplitude. Averaged IPSC traces before (black; pre) and 50–60 min after (gray; post) conditioning are shown. In this and subsequent figures, 10 consecutively acquired IPSCs were averaged. B, Time course of mean IPSC amplitude for 11 neurons. The IPSC amplitude was normalized to preconditioning baseline (acquired for 10 min) for each recorded neuron. The dashed line represents the mean normalized IPSC value before conditioning (arrow). C, Note that there is no change in averaged IPSCs (top) and normalized IPSC amplitude in the absence of any conditioning stimulation (n = 5). Inset, Representative averaged IPSCs during the first 10 min (left) and last 10 min (right) of the recording session. Error bars indicate SEM.
Figure 2.
Figure 2.
Long-lasting inhibitory potentiation is not associated with changes in PPR or CV. A, Example responses to paired-pulse stimuli are shown before conditioning (Pre; black trace) and 50–60 min after the conditioning stimuli (Post; gray trace). The PPR was computed as the ratio of IPSC2/IPSC1 using a 50 ms interstimulus interval (n = 6). There was no significant difference in PPR before and 50–60 min after conditioning (p = 0.75, paired t test). The arrow indicates the time when conditioning stimuli were applied. B, The CV of IPSCs amplitude throughout the recording session. Ten consecutive IPSCs were used to calculate each CV (SD of IPSCs amplitude divided by their mean amplitude). There was no significant difference in CV before and 50–60 min after the conditioning stimuli (p = 0.69, paired t test). The arrow indicates the time when conditioning stimuli were applied. Error bars indicate SEM.
Figure 3.
Figure 3.
Long-lasting inhibitory potentiation is associated with an increase in synaptic conductance without a change in EIPSC. A, Representative I–V curves for IPSCs before (black circles) and 50–60 min after (gray circles) conditioning. Insets, Example traces of IPSCs at various holding potentials before (black) and 50–60 min after (gray) conditioning. B, Summary plot of EIPSC values measured before (black) and 50–60 min after (gray) conditioning (n = 11). Data from the same cell are connected by a line. NS indicates no significant difference. C, Summary plot of synaptic conductance measured before (black) and 50–60 min after (gray) conditioning (n = 11). Data from the same cell are connected by a line. The difference in synaptic conductance before and 50–60 min after conditioning was highly significant (p = 0.0002, paired t test). ***p < 0.001.
Figure 4.
Figure 4.
Exogenous BDNF potentiates IPSCs and occludes additional inhibitory potentiation. A, BDNF exposure (100 ng/ml for 3 min; blue arrowhead) progressively increased IPSC amplitude in the absence of conditioning stimulation. Note IPSC potentiation is maximally expressed 50 min after BDNF application. Such BDNF-induced potentiation occluded additional inhibitory potentiation by subsequent conditioning (red arrow). The dashed line represents the mean normalized IPSCs amplitude before BDNF exposure (n = 6). Inset, Average IPSCs before (black; Pre BDNF) and 50–60 min after (blue; Post BDNF) BDNF application and 50–60 min after subsequent conditioning stimuli (gray; Post conditioning). B, The magnitude of long-lasting inhibitory potentiation compared among three experimental conditions: conditioning-induced inhibitory potentiation (control Potentiation), BDNF-induced potentiation (BDNF) and subsequent conditioning-induced potentiation (+Conditioning). NS indicates no significant difference. Error bars indicate SEM.
Figure 5.
Figure 5.
BDNF–TrkB signaling blockade prevents long-lasting inhibitory potentiation. A, Time course of mean IPSC amplitude before and after conditioning (red arrow) in the presence of intracellular k252a, a TrK receptor blocker (n = 5; blue triangles). The control record is the same as in Figure 1B (n = 11; black circles). The dashed line represents the mean normalized IPSCs amplitude before conditioning. B, Time course of mean IPSC amplitude before and after conditioning (red arrow) in the presence of extracellular TrkB-Fc (n = 5; green inverted triangles). The control record is the same as in Figure 1B (n = 11; black circles). The dashed line represents the mean normalized IPSCs amplitude before conditioning. C, A bar graph representation of the magnitude of potentiation shows a significantly reduced inhibitory potentiation in the presence of intracellular k252a or extracellular TrkB-Fc, when compared with controls. **p < 0.01. Error bars indicate SEM.
Figure 6.
Figure 6.
GABAA, GABAB, or mGlu receptors do not mediate long-lasting inhibitory potentiation. The IPSC amplitude, normalized to the initial baseline, was examined before and after conditioning (arrows) when 10 μm bicuculline was present during conditioning stimuli (A), 20 μm SCH-50911 was present during conditioning stimuli (B), or when 0.5 mm MCPG was present during conditioning stimuli (C). The thick gray lines in A–C show the time when each drug was present in the bath. The dashed lines represent the mean normalized IPSCs amplitude before conditioning stimuli. D, The bar graph shows that inhibitory potentiation magnitude did not differ significantly from control (NS) when GABAA, GABAB or mGlu receptors were blocked. Error bars indicate SEM.
Figure 7.
Figure 7.
Either sensorineural or conductive hearing loss reduced long-lasting inhibitory potentiation. A, An average IPSC is shown before (red) and 50–60 min after (light red) conditioning for a SNHL neuron. Time course of mean IPSC amplitude before and after conditioning (dark red arrow) for SNHL neurons (n = 12; red squares). The control record is the same as in Figure 1B (n = 11; black circles). The dashed line represents the mean normalized IPSCs amplitude before conditioning. B, An average IPSC is shown before (orange) and 50–60 min after (light orange) conditioning for a CHL neuron. Time course of mean IPSC amplitude before and after conditioning (dark orange arrow) for CHL neurons (n = 10; orange circles). The control record is same as in Figure 1B (n = 11; black circles). The dashed line represents the mean normalized IPSCs amplitude before conditioning. C, A bar graph representation of the magnitude of inhibitory potentiation shows a significantly reduced potentiation in sensorineural or conductive hearing loss animals (SNHL, CHL). Inhibitory potentiation expression in SNHL neurons was the least of the three groups. *p < 0.05 and ***p < 0.001. Error bars indicate SEM.
Figure 8.
Figure 8.
Exogenous BDNF potentiated IPSCs in SNHL neurons. Time course of mean normalized IPSC amplitude after BDNF exposure (100 ng/ml for 3 min; arrowhead) shows a progressive increase in SNHL neurons (n = 6). The dashed line represents the mean normalized IPSCs amplitude before BDNF exposure. The inhibitory potentiation magnitude observed in these SNHL neurons was equivalent to that observed in control neurons (Fig. 4). Error bars indicate SEM.

Similar articles

Cited by

References

    1. Abidin I, Eysel UT, Lessmann V, Mittmann T. Impaired GABAergic inhibition in the visual cortex of brain-derived neurotrophic factor heterozygous knockout mice. J Physiol. 2008;586:1885–1901. - PMC - PubMed
    1. Abraham WC, Bear MF. Metaplasticity: the plasticity of synaptic plasticity. Trends Neurosci. 1996;19:126–130. - PubMed
    1. Androutsellis-Theotokis A, McCormack WJ, Bradford HF, Stern GM, Pliego-Rivero FB. The depolarisation-induced release of [125I]BDNF from brain tissue. Brain Res. 1996;743:40–48. - PubMed
    1. Arancio O, Chao MV. Neurotrophins, synaptic plasticity and dementia. Curr Opin Neurobiol. 2007;17:325–330. - PubMed
    1. Baldelli P, Hernandez-Guijo JM, Carabelli V, Carbone E. Brain-derived neurotrophic factor enhances GABA release probability and nonuniform distribution of N- and P/Q-type channels on release sites of hippocampal inhibitory synapses. J Neurosci. 2005;25:3358–3368. - PMC - PubMed

Publication types

MeSH terms

Substances

LinkOut - more resources