Comparative Study
. 2010 Jan 6;30(1):361-71.
doi: 10.1523/JNEUROSCI.2233-09.2010.

Reducing intracortical inhibition in the adult visual cortex promotes ocular dominance plasticity

Affiliations
Comparative Study

Reducing intracortical inhibition in the adult visual cortex promotes ocular dominance plasticity

Alexey Harauzov et al. J Neurosci. .

Abstract

Experience-dependent plasticity in the cortex is often higher during short critical periods in postnatal development. The mechanisms limiting adult cortical plasticity are still unclear. Maturation of intracortical GABAergic inhibition is suggested to be crucial for the closure of the critical period for ocular dominance (OD) plasticity in the visual cortex. We find that reduction of GABAergic transmission in the adult rat visual cortex partially reactivates OD plasticity in response to monocular deprivation (MD). This is accompanied by an enhancement of activity-dependent potentiation of synaptic efficacy but not of activity-dependent depression. We also found a decrease in the expression of chondroitin sulfate proteoglycans in the visual cortex of MD animals with reduced inhibition, after the reactivation of OD plasticity. Thus, intracortical inhibition is a crucial limiting factor for the induction of experience-dependent plasticity in the adult visual cortex.


Figures

Figure 1.
Figure 1.
Rapid recovery of basal GABA release after the end of MPA treatment. GABA release determined by in vivo microdialysis at day 7, day 8, and day 9 after minipump implant in four animals. Day 7 is the last day of minipump delivering MPA. GABA release at day 7 is significantly lower than at days 8 and 9; the latter two do not differ (one-way repeated-measures ANOVA, #p < 0.05, post hoc Holm–Sidak test). In the comparison with control cortex (N = 7 animals), only GABA release at day 7 is significantly different (one-way ANOVA, *p < 0.002, post hoc Tukey's test). Error bars represent SEM.
Figure 2.
Figure 2.
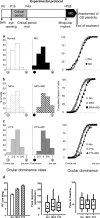
Reduction of cortical inhibition promotes OD plasticity in adult rat visual cortex. Top, Experimental protocol. a, Monocular deprivation is ineffective in adult control rats; left and middle, OD distribution for normal, nondeprived (Nor) (N = 5; 115 cells) and saline-treated, monocularly deprived adult rats (MD) (N = 4, 117 cells) do not significantly differ (χ2 test, n = 4, p > 0.05); right, same data represented as cumulative fraction of OD scores: the curve for normal animals (Nor) and control MD animals (MD) do not significantly differ [Kolmogorov–Smirnov (K-S) test, p > 0.05]. The cumulative fraction values represent the fraction of cells with an OD score less than or equal to a given OD score value. b, c, Left and middle, OD distributions for MPA-treated nondeprived (MPA) (N = 3, 90 cells); MPA-treated, monocularly deprived (MPA+MD) (N = 5, 147 cells); PTX-treated nondeprived (PTX) (N = 4, 98 cells); PTX-treated, monocularly deprived (PTX+MD) (N = 3, 91 cells) rats. Both MPA+MD and PTX+MD distributions are significantly shifted toward the nondeprived eye (ipsilateral eye) with respect to those for normal, MD, MPA, and PTX animals (p < 0.001, χ2 test; n = 4). MPA and PTX treatment without deprivation does not modify the OD distribution (χ2 test, n = 4, p > 0.05); right, same data represented as cumulative fractions of OD scores. The curves for the MPA+MD and PTX+MD groups are significantly shifted to the right (i.e., toward the nondeprived eye) with respect to those in normal and in treated nondeprived animals (K-S test, p < 0.05). Curves for undeprived MPA- or PTX-treated animals do not differ from that in normal animals (K-S test, p > 0.05). d, Functional properties of visual cortical neurons in the recorded animals. Left, Mean RF size, expressed in degrees (deg) of visual angle (±SEM); data for deprived and nondeprived MPA- or PTX-treated animals have been pooled together (no statistical difference, two-tailed t test). Normal (Nor) (115 cells), MPA-treated (MPA) (237 cells), and PTX-treated animals were recorded during the treatment (PTX) (189 cells). RFs are larger with respect to normal (one-way ANOVA, p < 0.001, Holm–Sidak post hoc test) both in MPA- and PTX-treated rats. Middle and right, Data for peak response and peak-to-baseline ratio are represented as box charts. For each box chart, the central horizontal line is the median value, and the other two horizontal lines are the 25 and 75% interquartile values; the filled square is the mean value, and the vertical bars are the 5 and 95% interquartile values. Peak response differs from normal only for MPA animals (one-way ANOVA, p < 0.05, post hoc Dunn's test); peak-to-baseline ratio (a measure of cell responsiveness) is unaffected by the treatments (one-way ANOVA, p > 0.05).
Figure 3.
Figure 3.
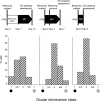
Reduction of intracortical inhibition is necessary for the inducibility of the OD shift in response to MD but is not necessary for its maintenance. Top line, Sketch of the experimental protocols. Bottom line, OD distributions obtained with the experimental protocol shown above. Left, The OD shift is induced only if MD is performed during the period of reduced intracortical inhibition. The OD distribution in animals (N = 4, 128 cells) subjected to 7 d of MD starting from day 8 after minipump implant (PTX; pumping ends at day 7) is not significantly different from that in control undeprived rats (χ2 vs OD distribution in normals, p = 0.34). Center, The OD shift persists after the end of the treatment. OD distribution in animals (N = 4, 114 cells) with a PTX minipump implanted the same day of MD onset and disconnected 2 d later; these animals were recorded 5 d after minipump removal (total MD days = 7). The OD distribution is still significantly shifted toward the nondeprived eye (χ2 test vs normal OD distribution, p < 0.001) and is not different from the OD distribution observed in animals deprived for 7 d and recorded while inhibition was still reduced (χ2 test vs PTX MD, p = 0.8). Right, Two days of MD are sufficient to induce a detectable OD shift. OD distribution in animals (N = 3, 81 cells) recorded after 2 d of MD and reduced inhibition (PTX minipump). The OD distribution is significantly shifted toward the nondeprived eye with respect to that in normal animals (χ2 vs normal OD distribution, p = 0.003).
Figure 4.
Figure 4.
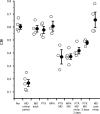
CBI values for all recorded animals in the different experimental groups. The open symbols represent data for single animals, and the filled symbols represent the mean CBI (±SEM) for each experimental group. CBIs for monocularly deprived rats treated with MPA or PTX significantly differ from CBIs in normal animals (Nor), saline-treated MD animals, and nondeprived MPA- or PTX-treated animals (one-way ANOVA, p < 0.001), whereas the latter four do not differ (p > 0.05). CBIs for animals monocularly deprived for 7 d but with minipump removed after 2 d (MD minipump 2 d) significantly differ from those in normal, saline-treated MD and nondeprived MPA- or PTX-treated animals but do not differ from those in MPA MD or PTX MD. CBIs for animals subjected to only 2 d of MD (MD 2 d) were significantly different from those in normal animals, saline-treated MD, nondeprived MPA- or PTX-treated animals, and animals subjected to 1 week MD after the end of the minipump infusion. CBIs for animals subjected to 1 week MD after the end of minipump infusion (MD post minipump) did not differ from those in normal, saline-treated MD and nondeprived MPA- or PTX-treated animals and were significantly different from those in monocularly deprived animals treated with MPA or PTX for 7 d, in animals subjected to only 2 d of MD, and in animals monocularly deprived for 7 d but with minipump removed after 2 d. CBIs for rats monocularly deprived during the critical period are different from those of all other groups (one-way ANOVA, p < 0.001).
Figure 5.
Figure 5.
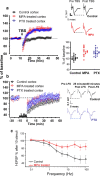
Treatment in vivo with MPA or PTX is sufficient to reactivate synaptic plasticity of the LTP type in adult visual cortex. a, Left, Average time course of layer III FP amplitude before and after TBS. The stimulating electrode was positioned at the border between WM and layer VI. Only slices from MPA (n = 13 slices, 9 animals) or PTX-treated animals (n = 19, 8 animals) show potentiation of the response after TBS. Right, Top, Average of 10 traces recorded from a control and a slice from an MPA-treated animal before and 25 min after TBS. Stimulus artifacts have been partially deleted. Only the MPA slice shows potentiation. Right, Bottom, Average and single cases of LTP in control, MPA, and PTX slices 25 min after TBS. Data for MPA and PTX are significantly potentiated with respect to control (one-way ANOVA, p < 0.001; post hoc Tukey's test MPA or PTX vs control, p < 0.05; MPA vs PTX, p > 0.05). b, Left, Average time course of layer III FP amplitude before and after LFS. The stimulating electrode was positioned at the border between WM and layer VI. Neither slices from controls (n = 11 slices, 6 animals) nor slices from MPA (n = 9 slices, 4 animals)- or PTX-treated animals (n = 10 slices, 4 animals) show depression of the response 60 min after LFS [two-way repeated-measures ANOVA, time (10 min) by condition (baseline vs 60 min after LFS)]. Right, Average of 10 traces recorded from a control and a slice from an MPA-treated animal before, and 25 and 60 min after LFS. Stimulus artifacts have been partially deleted. c, Average of layer III FP amplitude after 10 stimuli at different frequencies. The stimulating electrode was positioned at the border between WM and layer VI. MPA (n = 14 slices, 5 animals)-treated animals show less short-term depression of the response than control animals (n = 10 slices, 6 animals) (two-way repeated-measures ANOVA, p < 0.05). Error bars indicate SEM.
Figure 6.
Figure 6.
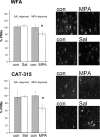
MD coupled with MPA (7 d) reduces CSPG expression in the adult visual cortex (treated cortex contralateral to the deprived eye). Top, Left, Density of WFA-positive cells in MPA and saline-treated rats. Density of WFA-positive profiles is normalized to that of the untreated cortex, ipsilateral to the deprived eye, of saline-treated animals. The cortex contralateral to the deprived eye shows a significantly lower density than the ipsilateral untreated cortex in MPA-treated rats (paired t test, *p = 0.036) but not in saline-treated rats (paired t test, p = 0.81). Error bars indicate SEM. Top, Right, Examples of WFA staining in the different experimental groups. Con, Control cortex ipsilateral to the deprived eye; MPA, MPA-treated cortex, contralateral to the deprived eye; Sal, saline-treated cortex, contralateral to the deprived eye. Bottom, Left, Density of Cat-315-positive cells in MPA and saline-treated rats. Density of Cat-315 profiles in each group is normalized to that of the untreated cortex, ipsilateral to the deprived eye, of saline-treated animals. The cortex contralateral to the deprived eye has a significantly lower density than the ipsilateral untreated cortex in MPA-treated rats (paired t test, p = 0.002) but not in saline-treated rats (paired t test, p = 0.98). Error bars indicate SEM. Bottom, Right, Examples of Cat-315 staining in the different experimental groups. Con, Control cortex ipsilateral to the deprived eye; MPA, MPA-treated cortex; Sal, saline-treated cortex. Scale bar, 65 μm.

Similar articles

Cited by

References

    1. Baranes D, Lederfein D, Huang YY, Chen M, Bailey CH, Kandel ER. Tissue plasminogen activator contributes to the late phase of LTP and to synaptic growth in the hippocampal mossy fiber pathway. Neuron. 1998;21:813–825. - PubMed
    1. Benevento LA, Bakkum BW, Cohen RS. gamma-Aminobutyric acid and somatostatin immunoreactivity in the visual cortex of normal and dark-reared rats. Brain Res. 1995;689:172–182. - PubMed
    1. Berardi N, Pizzorusso T, Maffei L. Critical periods during sensory development. Curr Opin Neurobiol. 2000;10:138–145. - PubMed
    1. Berardi N, Pizzorusso T, Ratto GM, Maffei L. Molecular basis of plasticity in the visual cortex. Trends Neurosci. 2003;26:369–378. - PubMed
    1. Ciucci F, Putignano E, Baroncelli L, Landi S, Berardi N, Maffei L. Insulin-like growth factor 1 (IGF-1) mediates the effects of enriched environment (EE) on visual cortical development. PLoS One. 2007;2:e475. - PMC - PubMed

Publication types

LinkOut - more resources