Comparative Study
. 2010 Jan 6;30(1):390-403.
doi: 10.1523/JNEUROSCI.2115-09.2010.

Glycine release from radial cells modulates the spontaneous activity and its propagation during early spinal cord development

Affiliations
Comparative Study

Glycine release from radial cells modulates the spontaneous activity and its propagation during early spinal cord development

Anne-Laure Scain et al. J Neurosci. .

Abstract

Rhythmic electrical activity is a hallmark of the developing embryonic CNS and is required for proper development in addition to genetic programs. Neurotransmitter release contributes to the genesis of this activity. In the mouse spinal cord, this rhythmic activity occurs after embryonic day 11.5 (E11.5) as waves spreading along the entire cord. At E12.5, blocking glycine receptors alters the propagation of the rhythmic activity, but the cellular source of the glycine receptor agonist, the release mechanisms, and its function remain obscure. At this early stage, the presence of synaptic activity even remains unexplored. Using isolated embryonic spinal cord preparations and whole-cell patch-clamp recordings of identified motoneurons, we find that the first synaptic activity develops at E12.5 and is mainly GABAergic. Using a multiple approach including direct measurement of neurotransmitter release (i.e., outside-out sniffer technique), we also show that, between E12.5 and E14.5, the main source of glycine in the embryonic spinal cord is radial cell progenitors, also known to be involved in neuronal migration. We then demonstrate that radial cells can release glycine during synaptogenesis. This spontaneous non-neuronal glycine release can also be evoked by mechanical stimuli and occurs through volume-sensitive chloride channels. Finally, we find that basal glycine release upregulates the propagating spontaneous rhythmic activity by depolarizing immature neurons and by increasing membrane potential fluctuations. Our data raise the question of a new role of radial cells as secretory cells involved in the modulation of the spontaneous electrical activity of embryonic neuronal networks.


Figures
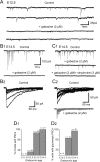
Figure 1.
Figure 1.
Spontaneous activity recorded in MNs from E12.5 to E14.5. A, Example of spontaneous activity recorded from an E12.5 MN. Application of 2 μm gabazine blocked postsynaptic-like events (bottom traces), whereas small events were not affected. B, C, Example of postsynaptic activity recorded at E13.5 and E14.5. B1, In a representative MN, gabazine application (2 μm) completely suppressed PSCs, indicating that they are mainly GABAergic. B2, Superimposed traces of gabazine-sensitive PSCs (same MN as in B1; n = 10). C1, In another representative MN (E14.5), gabazine did not completely inhibit spontaneous postsynaptic activity. These gabazine-resistant PSCs were completely blocked by strychnine (3 μm; bottom trace), indicating that they were glycinergic. C2, Superimposed PSCs recorded in control conditions (top trace; n = 10) or in the presence of gabazine (3 μm; bottom trace; n = 10). D1, Proportion of MNs with PSC frequency >0.05 Hz at E11.5–E14.5. D2, Glycinergic PSCs were first detected at E13.5 and the proportion of cells displaying glycinergic PSCs increased at E14.5.
Figure 2.
Figure 2.
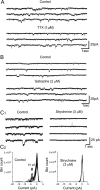
Spontaneous single-channel activity recorded in E12.5 lumbar MNs. A, Spontaneous single-channel currents obtained in patch-clamp whole-cell recordings were insensitive to 1 μm TTX. B, Spontaneous activity was not prevented by gabazine application, indicating that it does not only represent openings of GABAA receptors. C1, Conversely, an application of strychnine inhibited this activity, revealing GlyR activation. C2, Superimposed point-per-point amplitude histograms of channel openings obtained before (left) and during (right) strychnine application. Each histogram was built from 12 consecutive 10 s epochs.
Figure 3.
Figure 3.
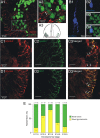
Radial cells contain glycine in the mouse lumbar embryonic spinal cord. A1, Double glycine (red) and Islet1/2 (green) immunostaining at E12.5. A2, Note that glycine-ir fibers (red) invade the motoneuronal area surrounding Islet1/2-ir MNs (arrowheads). A3, Scheme of the sagittal slice in A1 showing the location of Islet1/2-ir MNs (green). d, Dorsal; v, ventral; vz, ventricular zone. B1, Confocal image of an E12.5 neuron, located in the MN area, recorded and filled with Neurobiotin. The image represents a stack of 91 confocal optical sections (0.3 μm thick each). B2–B4, Example of a neuron filled with Neurobiotin and immunostained with the MN marker Islet1/2. C, Double glycine (C1; red) and nestin (C2; green) immunostaining at E12.5. D, Double glycine (D1; red) and RC2 (D2; green) labeling at E12.5. C3, D3, Nestin-ir and RC2-ir fibers (arrows) contain glycine. E, Changes in the percentage of RCs expressing glycine between E11.5 and E15.5. The percentage of RCs expressing glycine (yellow) is maximal at E13.5. Above the bars are shown the number of SC sections analyzed. Error bars indicate SEM. C, D, Each image corresponds to a single 0.3-μm-thick confocal section.
Figure 4.
Figure 4.
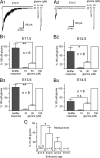
Estimation of the endogenous [glycine]o within the motoneuronal area using the sniffer technique. A, Left-hand traces, Examples of GlyR activity recorded from a sniffer positioned (horizontal line) within the lumbar motoneuronal area at E12.5 (A1) and at E14.5 (A2). A1, Note that, at E12.5, GlyRs remained activated 15 min after positioning the electrode within the SC. The right-hand panels in A1 and A2 correspond to sniffer responses evoked by exogenous application of 10, 30, and 100 μm glycine onto the same outside-out patch illustrated on the left panels. Glycine was applied after pulling the sniffer electrode out of the SC. B, Estimation of the [glycine]o detected by the sniffer patch at E11.5 (B1), E12.5 (B2), E13.5 (B3), and E14.5 (B4). To compare sniffer responses observed after positioning the electrode within the SC with responses evoked by different exogenous applications of glycine, responses were normalized to currents evoked by 100 μm glycine. Note that the peak amplitude of the currents obtained within the motoneuronal area (gray bar) at E11.5 (B1), E12.5 (B2), and E13.5 (B3) was significantly different from the amplitude of the current evoked by the application of ≤30 μm glycine (ANOVA test, *p < 0.05, **p < 0.01). B4, Endogenous [glycine]o, estimated at the peak of the sniffer response, was close to 30 μm at E14.5. C, The residual concentration level of glycine in the extracellular space was estimated 15 min after positioning the sniffer electrode within the motoneuronal area. The residual sniffer response amplitude was normalized to the outside-out current evoked by 10 μm glycine application. Note that the basal concentration of glycine was maximal at E12.5 and E13.5 (Kruskal–Wallis test, *p < 0.05). It was probably between 3 and 10 μm, 3 μm glycine being unable to activate homomeric α2 GlyRs. Note that, at E14.5, the sniffer electrode failed to detect the presence of glycine in the extracellular space. Error bars indicate SEM.
Figure 5.
Figure 5.
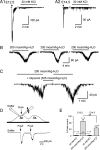
Glycine release can be evoked by hypotonic shocks. A1, GlyR activity in a sniffer patch recorded in an E12.5 SC with the sniffer electrode positioned (arrow) within the motoneuronal area. Application of 30 mm KCl did not evoke any significant increase in GlyR activity at E12.5. A2, Similar experiment performed at E14.5. B, Repetitive outside-out sniffer GlyR activation in response to 200 mosmol/kg H2O solution at E13.5 (control, 325 mosmol/kg H2O; 10 min interval between applications). C, The effect of a hypotonic solution can be reversed by a glycerol-supplemented solution (325 mosmol/kg H2O). D, A mechanical stimulation made using a fire-polished club-ending patch pipette (arrow) on the ventral part of the SC evoked reproducible sniffer GlyR activation. E, Amplitudes of responses evoked by 30 mm KCl or hypotonic solutions, normalized to the peak amplitude of the current evoked when penetrating the SC. Note that the amplitude of the sniffer response evoked by a hypotonic solution significantly decreased (Mann–Whitney test, **p < 0.01) between E12.5 and E14.5. Error bars indicate SEM.
Figure 6.
Figure 6.
Glycine can be released by RCs in E12.5 embryonic spinal cords. A, Double immunostaining showing glycine-ir RCs in control conditions (325 mosmol/kg H2O). Anti-nestin (green), anti-glycine (red), and merged images are shown. Arrows, Examples of double-stained RC end feet. B, Exposing the embryonic SC to 200 mosmol/kg H2O solution during 1 h in the presence of GlyT blockers abolished the glycine labeling in nestin-ir RCs. Images are single 0.3-μm-thick confocal images. C, Variation in the proportion of double-stained glycine/nestin RC fibers according to various pharmacological treatments. Note that the simultaneous application of SKF-96365 and flufenamic acid partially reversed the effect induced by a hypotonic solution in the presence of GlyT blockers. Statistical tests are one-way ANOVA followed by a Dunnett's multiple comparison (test vs control or hypotonic/GlyT blockers: *p < 0.05; **p < 0.01). The number of sections analyzed in each condition is indicated above the bars. Error bars indicate SEM.
Figure 7.
Figure 7.
Glycine transporter GlyT1 participates in glycine clearance from the extracellular space. A1, B1, Examples of sniffer responses recorded at E12.5 (A1) and at E14.5 (B1) in the absence of the GlyT1 blocker ALX-5407. The sniffer response time course was estimated by measuring the duration of the sniffer current at 20% of the peak amplitude of the deactivation phase of the sniffer current. Note that the deactivation time course of the outside-out currents recorded at E14.5 became considerably faster than at E12.5 and that channel activity of the sniffer disappeared 2–4 min after positioning the sniffer electrode in the motoneuronal area. A2, B2, Effect of ALX-5407, a GlyT1 blocker, on the time course of the sniffer current at E12.5 (A2) and at E14.5 (B2). Note that the application of ALX-5407 at E14.5 considerably lengthened the sniffer response (B2). C, The 20% peak amplitude duration of the sniffer current from E11.5 to E14.5. Note that the 20% peak amplitude duration is shorter at E14.5 (Kruskal–Wallis test, **p < 0.01). D, Effect of ALX-5407 on the sniffer response time course, estimated by the duration of the sniffer current measured at 20% of the peak amplitude (see traces in A and B). ALX-5407 application significantly increased the 20% peak amplitude duration of the sniffer current both at E12.5 (137.7 ± 16.8 s; n = 21) and E14.5 (110.1 ± 27.4 s; n = 7) (Mann–Whitney test, *p < 0.05, **p < 0.01). In contrast to what is observed in control conditions (black bars; Mann–Whitney test, **p < 0.01), the 20% peak amplitude duration measured in the presence of ALX-5407 (white bars) was not significantly different between E12.5 and E14.5 (Mann–Whitney test, p > 0.1). Error bars indicate SEM.
Figure 8.
Figure 8.
Effect of TTX, low [Ca2+]o, Gd3+, flufenamic acid, or SKF-96365 on glycine release evoked by the application of a hypotonic solution. A, TTX application did not significantly change the amplitude of the sniffer currents (105.8 ± 9.8% of control; n = 5) evoked by the application of a hypotonic solution, indicating that the glycine release evoked by membrane stretch caused by cell swelling is independent of Na+ action potential firing. B, To determine whether glycine release evoked by hypotonic solution is dependent on external Ca2+, we analyzed the effect of a low Ca2+ external solution (0 mm [Ca2+]o and 1 mm EGTA). The amplitude of the evoked sniffer current was significantly (Wilcoxon's test, p < 0.01) and reversibly decreased by 56.9 ± 11% (n = 4) in the presence of a Ca2+-free solution, indicating that glycine release in response to membrane stretch necessitates Ca2+ influx. C, Application of 100 μm gadolinium (Gd3+) reversibly inhibited the sniffer response to hypotonic shock by 61.2 ± 7.4% (n = 4). D, E, A single application (2–4 min) of 100 μm flufenamic acid or 100 μm SKF-96365 evoked an inhibition of the sniffer response by 89.1 ± 2.6% (n = 5) and 81.6 ± 5.4% (n = 8), respectively. The sniffer responses induced by hypotonic solution were still decreased 10 min after the end of the application of these inhibitors. This was not attributable to direct inhibition of glycine-evoked responses (supplemental Fig. 7, available at www.jneurosci.org as supplemental material). Ten minutes after the end of the application of flufenamic acid and SKF-96365, sniffer response were decreased by 81.4 ± 7.3 and 62.4 ± 4.6%, respectively. The inhibition evoked by flufenamic acid still remains significantly higher than Gd3+-evoked inhibition (Mann–Whitney test, p < 0.05). In two sniffer patches, we found that inhibition of the sniffer responses still occurred 20 min after washing out SKF-96365 or flufenamic acid (data not shown).
Figure 9.
Figure 9.
Glycine released by RCs in E12.5 spinal cords was not impaired after blocking vesicular proton transporters but was inhibited by VSOR blockers. A1, Spontaneous postsynaptic activity recorded in control conditions and in the presence of 30 mm KCl. Note the dramatic increase in PSC activity (insets) during the application of 30 mm KCl. A2, Preincubation of SCs with 4 μm bafilomycin A1 resulted in a complete disappearance of spontaneous or evoked (inset) PSCs. A3, A hypotonic shock can still evoke GlyR activation of a sniffer patch in SCs preincubated with bafilomycin A1. The sniffer response shown in A3 and the whole-cell current shown in A2 were obtained from the same SC. Bafilomycin A1 experiments were performed on E14.5 lumbar SC. B1–B3, Confocal sections showing that glycine (red) is still detected in nestin-ir RCs (green) when DCPIB (10 μm) is added to the ACSF after a hypotonic challenge in the presence of GlyT blockers. The arrows point to glycine-ir RC end feet. B4, Variation in the proportion of double-stained glycine/nestin RC fibers according to pharmacological treatment. Statistical tests are one-way ANOVA followed by a Dunnett's multiple comparison (test vs control or hypotonic/GlyT blockers: *p < 0.05; **p < 0.01). The number of sections analyzed in each condition is indicated above the bars. Error bars indicate SEM.
Figure 10.
Figure 10.
Glycine release controls the spontaneous activity at E12.5. A, Simultaneous extracellular recordings of spontaneous activity at cervical (C), thoracic (T), and lumbar (L) levels from E12.5 spinal cords in the absence (A1) and in the presence (A2) of strychnine. Strychnine (5 μm) slowed down the frequency of spontaneous activity simultaneously recorded at cervical (C), thoracic (T), and lumbar (L) levels from E12.5 spinal cords. Note the reduction of the burst intensity and the decrease of the rostrocaudal propagation speed in the presence of strychnine. The arrows point at recurring bursts of activity. B, Blocking GlyT1 by ALX-5407 (1 μm) accelerated the spontaneous activity frequency and increased the burst intensity. C, Rostrocaudal propagation of bursts of activity evoked by electrical stimulation (0.04 V) at the cervical level (closed to the cervical recording electrode) could be blocked by strychnine when using threshold intensity (C2) but was restored when slightly increasing the intensity of stimulation (0.05 V) (C3). Note the longer propagation delay in the presence of strychnine.

Similar articles

Cited by

References

    1. Allain AE, Baïri A, Meyrand P, Branchereau P. Expression of the glycinergic system during the course of embryonic development in the mouse spinal cord and its co-localization with GABA immunoreactivity. J Comp Neurol. 2006;496:832–846. - PubMed
    1. Aragón MC, Giménez C, Mayor F. Stoichiometry of sodium- and chloride-coupled glycine transport in synaptic plasma membrane vesicles derived from rat brain. FEBS Lett. 1987;212:87–90. - PubMed
    1. Barry D, McDermott K. Differentiation of radial glia from radial precursor cells and transformation into astrocytes in the developing rat spinal cord. Glia. 2005;50:187–197. - PubMed
    1. Ben-Ari Y. Developing networks play a similar melody. Trends Neurosci. 2001;24:353–360. - PubMed
    1. Ben-Ari Y, Khalilov I, Represa A, Gozlan H. Interneurons set the tune of developing networks. Trends Neurosci. 2004;27:422–427. - PubMed

Publication types

LinkOut - more resources