Comparative Study
. 2010 Jan 6;30(1):404-15.
doi: 10.1523/JNEUROSCI.4093-09.2010.

Continuous electroencephalographic monitoring with radio-telemetry in a rat model of perinatal hypoxia-ischemia reveals progressive post-stroke epilepsy

Affiliations
Comparative Study

Continuous electroencephalographic monitoring with radio-telemetry in a rat model of perinatal hypoxia-ischemia reveals progressive post-stroke epilepsy

Shilpa D Kadam et al. J Neurosci. .

Abstract

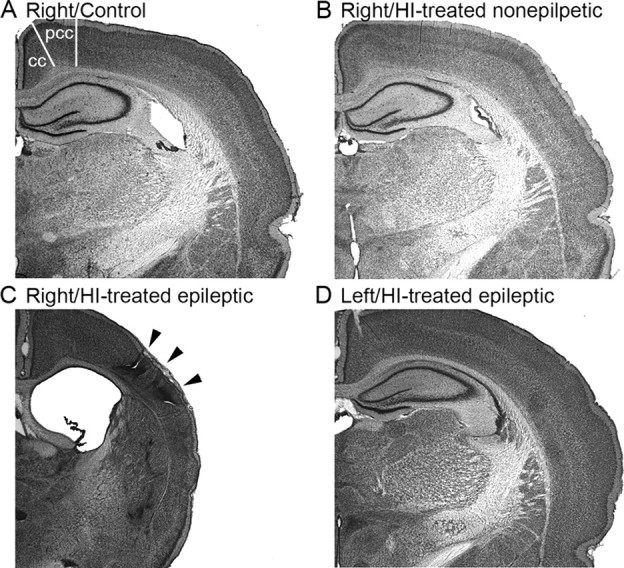
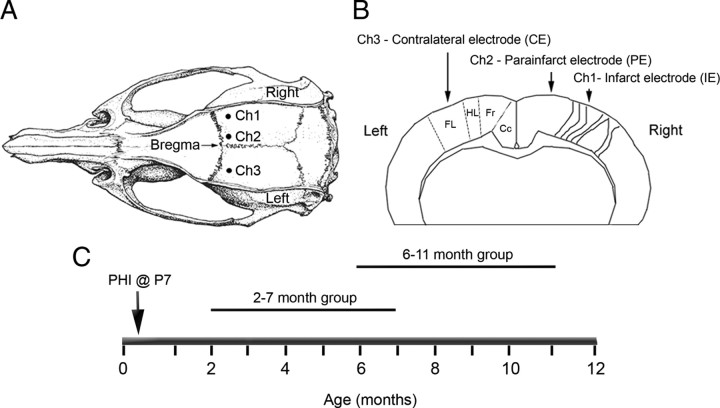
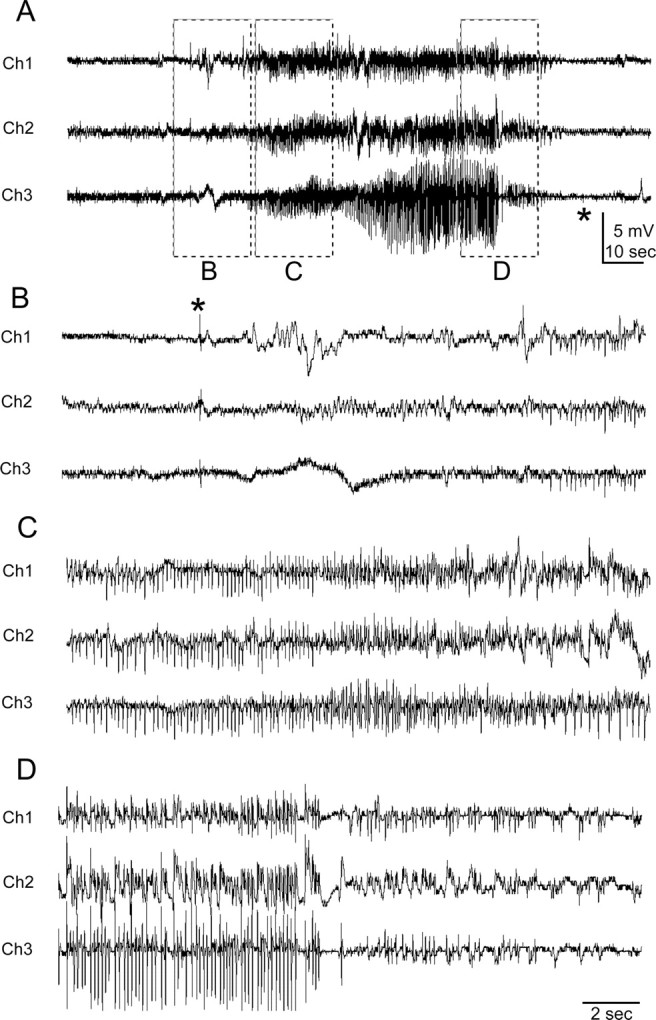
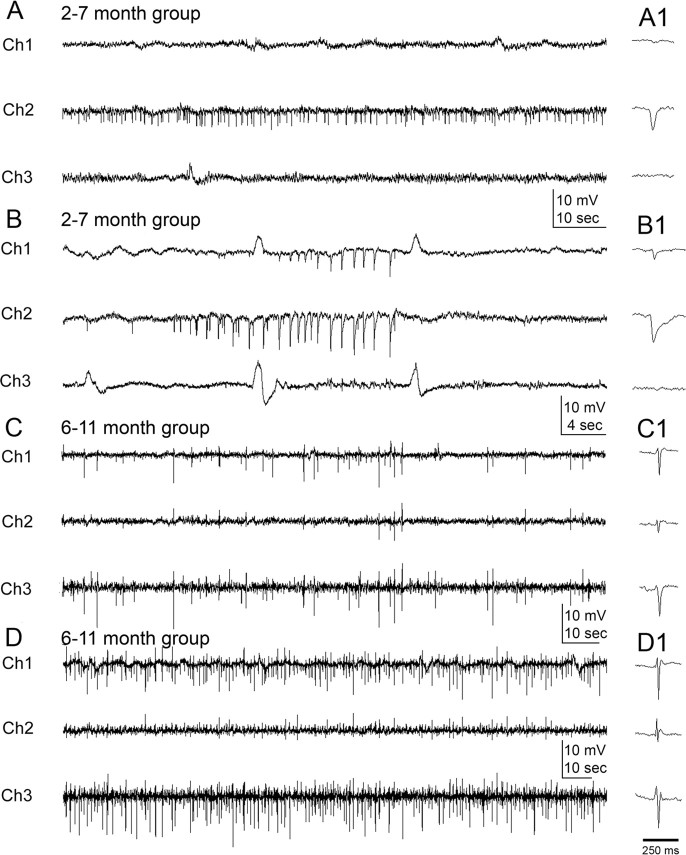
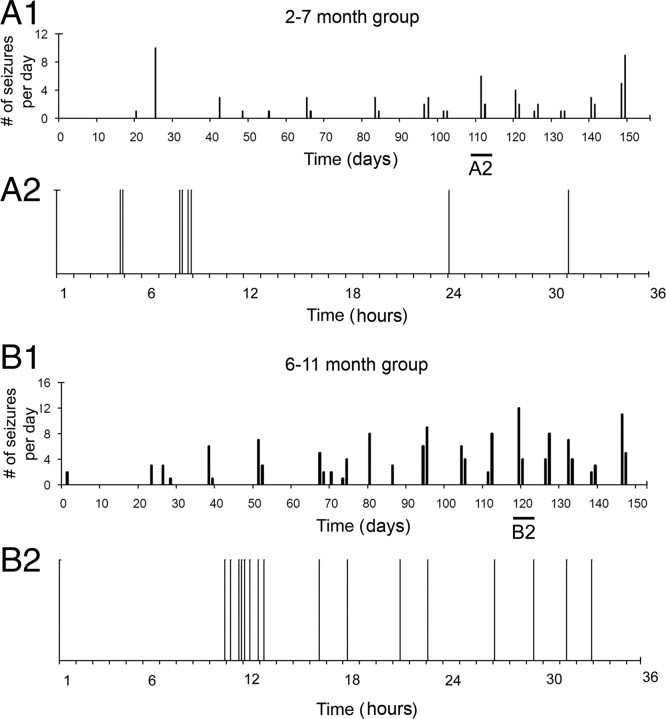
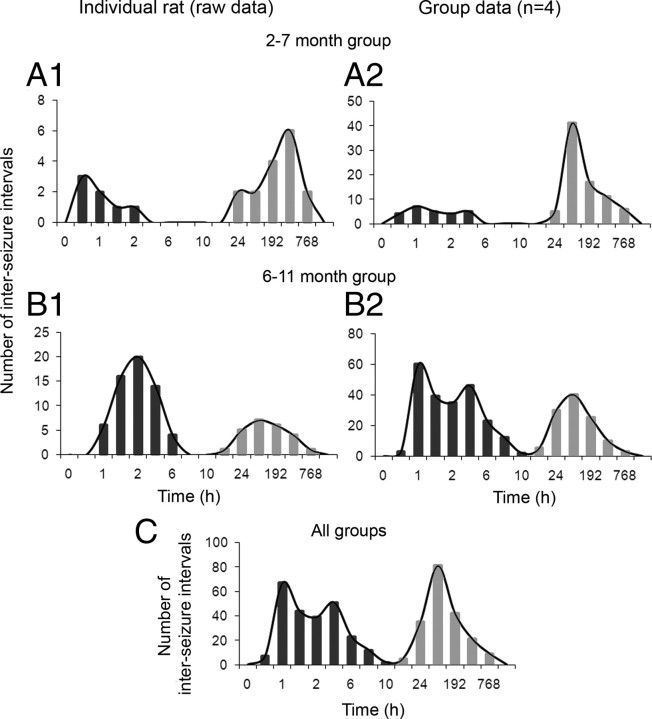
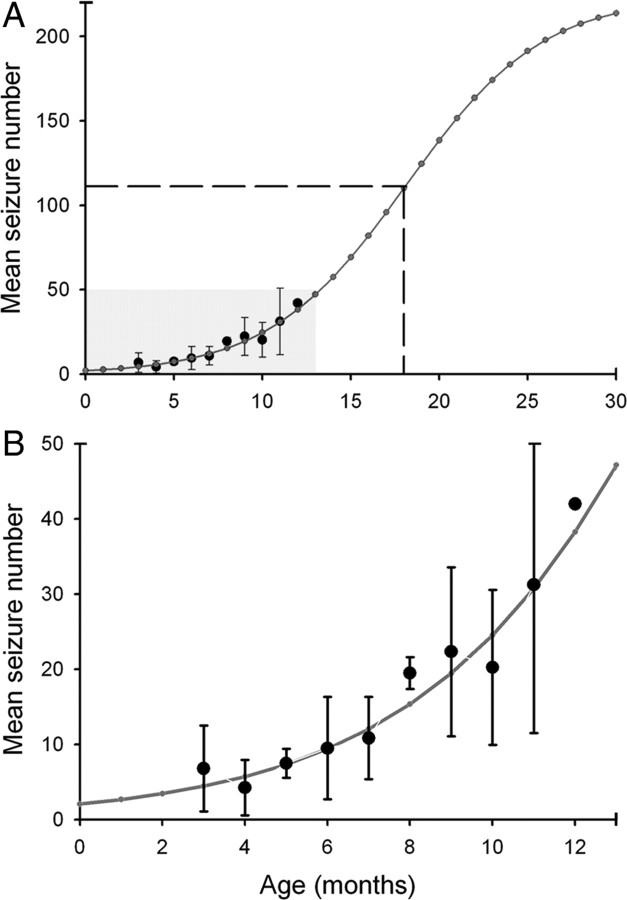
The development of acquired epilepsy after a perinatal hypoxic-ischemic (HI) insult was investigated in rats. After unilateral carotid ligation with hypoxia on postnatal day 7, cortical electroencephalographic and behavioral seizures were recorded with continuous radio-telemetry and video. Chronic recordings were obtained between 2 and 12 months of age in freely behaving HI-treated and sham control rats. The hypotheses were that the acquired epilepsy is directly associated with an ischemic infarct (i.e., no lesion, no epilepsy), and the resultant epilepsy is temporally progressive. Every HI-treated rat with a cerebral infarct developed spontaneous epileptiform discharges and recurrent seizures (100%); in contrast, no spontaneous epileptiform discharges or seizures were detected with continuous monitoring in the HI-treated rats without infarcts. The initial seizures at 2 months generally showed focal onset and were nonconvulsive. Subsequent seizures had focal onsets that propagated to the homotopic contralateral cortex and were nonconvulsive or partial; later seizures often appeared to have bilateral onset and were convulsive. Spontaneous epileptiform discharges were initially lateralized to ipsilateral neocortex but became bilateral over time. The severity and frequency of the spontaneous behavioral and electrographic seizures progressively increased over time. In every epileptic rat, seizures occurred in distinct clusters with seizure-free periods as long as a few weeks. The progressive increase in seizure frequency over time was associated with increases in cluster frequency and seizures within each cluster. Thus, prolonged, continuous seizure monitoring directly demonstrated that the acquired epilepsy after perinatal HI was progressive with seizure clusters and was consistently associated with a cerebral infarct.


Figures

Figure 1.
Figure 1.
Unilateral infarct after ligation of the right carotid artery at postnatal day 7. A–C, Coronal sections from control animal (A), HI-treated animal without an ischemic lesion (B), and an HI-treated rat with a clear ischemic lesion (C, D). The rat brains were stained with cresyl violet (i.e., Nissl stain). Right hemispheres in A and B are comparable, in contrast to C, which shows the parasagittal infarct (arrowheads) and related cortical atrophy and an enlarged lateral ventricle. The contralateral (left) hemisphere (D) is shown from the same section as in C and illustrates that the left hemisphere was not lesioned. cc, Cingulate cortex; pcc, paracingulate cortex.
Figure 2.
Figure 2.
Schematic diagrams of the electrode placement for chronic radio-telemetric monitoring of cortical EEG and of the recording periods in the study. A, Dorsal skull surface of rat showing locations of the three subdural, bipolar recording electrodes over the two hemispheres (modified from Paxinos and Watson, 1998). B, Schematic diagram of the coronal view for the cortical surface locations of the three subdural electrodes. The electrodes were placed over the bilateral forelimb motor and paracingulate cortices, and their respective channel numbers are denoted for the recorded cortical EEG data. Ch1, Core of the ipsilateral cortical infarct (parasagittal unparallel lines in right neocortex denote ischemic lesion, IE); Ch2, ipsilateral paracingulate neocortex (medial to cortical infarct, PE); Ch3, contralateral cortex (CE). Cc, Cingulate cortex; Fr, frontal cortex; HL, hindlimb area of cortex; FL, forelimb area of cortex. C, Schematic diagram of the two recording periods after the postnatal day 7 ligation surgery.
Figure 3.
Figure 3.
Representative spontaneous generalized seizure recorded with telemetry. The recording electrodes (Fig. 2) for this and the subsequent figures were located over the infarct (Ch1, IE), medial to the lesion at a parainfarct site (Ch2, PE), and on the contralateral neocortex (Ch3, CE). A, Trace of the entire grade 5 seizure that lasted 110 s. B–D represent the EEG trace of the same seizure with an expanded timescale and higher gain. B, Seizure initiation with a single large EEG spike (*) seen on all leads. C, Progression pattern of regular high-frequency, large-amplitude EEG spikes during the tonic phase of the seizure. D, EEG activity near the termination phase of the seizure in which EEG spikes became smaller in amplitude and interspersed with silent periods before termination of the seizure indicated by a silent EEG (* in A).
Figure 4.
Figure 4.
Interictal-spike and sharp-wave activity at 2 and 6 months after HI treatment. A, At 2 months, interictal spikes were often only recorded from the parainfarct electrode (Ch2). B, In other cases after 2 months, interictal spikes were recorded at both the parainfarct site (Ch2, PE) and over the infarct (Ch1, IE) with a clear onset of spike clusters adjacent to the lesion. Spike activity was rare on the contralateral electrode (Ch3, CE) at 2 months. C, D, After 6 months, the chronically epileptic rats showed interictal activity of variable frequency on the ipsilateral electrodes (Ch1 and Ch2) that was also consistently present on the contralateral electrode (Ch3). C, When interictal spikes were recorded on all three electrodes, the frequency could differ across the three channels (e.g., a lower frequency is shown on Ch2 compared with Ch1 and Ch3). D, When spikes occurred between seizures within a cluster, interictal spike frequency was higher (∼1 Hz) than between clusters. A1, B1, C1, and D1 illustrate individual spikes (<70 ms) and sharp waves (70 to 200+ ms) from near the center of the respective traces.
Figure 5.
Figure 5.
Onset of electrographic seizure activity: unilateral versus bilateral. A1, At 2 months of age, seizure onsets were recorded ipsilateral to the HI lesion. Examination of the three EEG channels (Ch1, IE; Ch2, PE; Ch3, CE) showed that seizure activity was initiated medial to the lesion (i.e., Ch 2, PE) seconds before spiking activity occurred over the ischemic lesion (Ch 1, IE), followed by activity over the contralateral hemisphere (Ch 3). A2 is an expansion of the EEG trace marked by a solid black line in A1. B, A representative tonic–clonic convulsive seizure (i.e., grade 5 on the Racine scale) recorded in a 6–11 month rat. Expansions in the bottom row show onset of seizure heralded by the initial large-amplitude sentinel spike (1), followed by rhythmic spiking activity first seen on Ch2 (2) and then on Ch2 and Ch3 (3). Low-amplitude high-frequency spiking was then seen in all three channels (4). Rhythmic 6–7 Hz large-amplitude synchronous spike-wave activity was seen on all three channels (5). Termination of the seizure occurred with large-amplitude, low-frequency spike-wave activity with intervening silent periods (6).
Figure 6.
Figure 6.
Increase in seizure frequency and severity over time. A, Continuous video-EEG monitoring revealed an increase in seizure frequency and severity [Racine scale (Racine, 1972)] over time in HI rats implanted at 2 months and at ≥6 months. Bar graph shows a stacked column analysis for partial (grades 1–3) and generalized (grades 4 and 5) seizures over time for 10 HI-treated epileptic rats averaged over 11 months. B, Graphs of the data from A with a best-fit exponential growth curve (dotted line) and sigmoid curve (solid line). The sigmoid curve was a best fit for the data. C, Data from A with a sigmoid growth curve (solid line) shown here together with 7 months of data acquired from a separate group (Kadam and Dudek, 2007) of HI-treated epileptic rats (dashed line), which were behaviorally video monitored (i.e., no EEG recordings, so data were obtained non-invasively) for 1 week every month (i.e., 1 of 4 or 25% of the monitoring time, starting at 1 month of age, or 1 month before the recordings with radio-telemetry were initiated). The best-fit sigmoid curve (dashed line) for the behavioral data (triangles) is parallel to the sigmoid curve for the radio-telemetry data with lower mean values of seizure frequency.
Figure 7.
Figure 7.
Analysis of seizure durations by severity and as a function of time. A, Bar graph of mean seizure durations for increasing grades of seizure severity classified according to the Racine scale (Racine, 1972). B, Mean seizure duration (gray open squares) plotted as a function of time after HI insult shows that mean seizure duration in the first month of recording (2–7 month rats) was ∼60 s, progressively increased over the next 3 months, and then decreased to ∼80 s. The superimposed mean seizure frequencies (filled black circles) for those same times show that the gradual decline in the mean seizure duration after the sixth month coincided with the exponential growth phase of the sigmoid curve for seizure progression as a function of time. C, Mean behavioral seizure scores over time indicate a rapid progression in severity from partial to generalized seizures after the first month of monitoring.
Figure 8.
Figure 8.
Plots of the seizure frequency over time showing seizure clusters. Continuous EEG monitoring recorded virtually every seizure, which revealed clusters of seizures within periods of 24–48 h, followed by seizure-free periods of several days to a few weeks. A1, Seizure clusters seen in a rat implanted at 2 months of age with an expansion of seizure distribution within one of these clusters spread over 36 h (A2). Of note in the raster plot is the clustering of seizures occurring within a 42 min period in the eighth hour of the plot with interseizure intervals of 5, 28, and 9 min. B1, Temporal distribution of seizures within a cluster seen in a rat implanted at 6 months of age (B2). Note the overall increased number of seizures within clusters in B1 compared with A1. Also of note in B2 is the occurrence of eight seizures within a period of 140 min occurring ∼12 h into the plot with interseizure intervals of 25, 26, 19, 4, 19, 29, and 18 min consecutively.
Figure 9.
Figure 9.
Interseizure intervals plotted as a function of interval durations. A1, A2, Plots show two prominent peaks in the distribution of interseizure intervals, in which the shorter intervals were between seizures within clusters and the longer intervals were between clusters (i.e., last seizure in one cluster and first seizure in the next cluster) for an individual epileptic rat from the 2–7 month group (A1) and the group data for the 2–7 month group of rats (A2). B1, B2, Plots show two prominent peaks similar to above for a single epileptic rat from the 6–11 month group (B1) and for the group data from the 6–11 month group of rats (B2). C, Interseizure intervals plotted as a function of interval durations of pooled data from both the young and old group of epileptic rats [n = 8; data for rats excluded from the group analysis (n = 2) is depicted in supplemental Fig. 3, available at www.jneurosci.org as supplemental material] showing the trough between the peaks still between 8 and 24 h. Time bins (h) for frequency histograms: 0.1, 0.5, 1, 2, 4, 6, 8, 10, 12, 24, 96 (4 d), 192 (8 d), 384 (16 d), 768 (32 d), and 1536 (64 d); applies to A–C and supplemental Figure 3 (available at www.jneurosci.org as supplemental material).
Figure 10.
Figure 10.
Predictions of seizure progression from seizure-frequency data after continuous radio-telemetry recording. A, Modeling of seizure progression over an extended period of time by using parameters obtained from the equation of the best-fit sigmoid curve predicted a half-maximal seizure rate of ∼111.5 seizures per month at the age of 18 months for HI-treated epileptic rats in this study (A, dashed lines). The estimated maximal seizure rate was ∼223 seizures per month. B, Magnified view of predictive curve for the initial months after the HI insult for time periods highlighted in A in gray.

Similar articles

Cited by

References

    1. Aneja S, Ahuja B, Taluja V, Bhatia VK. Epilepsy in children with cerebral palsy. Indian J Pediatr. 2001;68:111–115. - PubMed
    1. Badawi N, Felix JF, Kurinczuk JJ, Dixon G, Watson L, Keogh JM, Valentine J, Stanley FJ. Cerebral palsy following term newborn encephalopathy: a population-based study. Dev Med Child Neurol. 2005;47:293–298. - PubMed
    1. Ben-Ari Y. Limbic seizure and brain damage produced by kainic acid: mechanisms and relevance to human temporal lobe epilepsy. Neuroscience. 1985;14:375–403. - PubMed
    1. Bergamasco B, Benna P, Ferrero P, Gavinelli R. Neonatal hypoxia and epileptic risk: a clinical prospective study. Epilepsia. 1984;25:131–136. - PubMed
    1. Bertram EH, Cornett J. The ontogeny of seizures in a rat model of limbic epilepsy: evidence for a kindling process in the development of chronic spontaneous seizures. Brain Res. 1993;625:295–300. - PubMed

Publication types