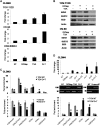
Derepression of CLDN3 and CLDN4 during ovarian tumorigenesis is associated with loss of repressive histone modifications
- PMID: 20053926
- PMCID: PMC2878357
- DOI: 10.1093/carcin/bgp336
Derepression of CLDN3 and CLDN4 during ovarian tumorigenesis is associated with loss of repressive histone modifications
Abstract
Unlike epigenetic silencing of tumor suppressor genes, the role of epigenetic derepression of cancer-promoting genes or oncogenes in carcinogenesis remains less well understood. The tight junction proteins claudin-3 and claudin-4 are frequently overexpressed in ovarian cancer and their overexpression was previously reported to promote the migration and invasion of ovarian epithelial cells. Here, we show that the expression of claudin-3 and claudin-4 is repressed in ovarian epithelial cells in association with promoter 'bivalent' histone modifications, containing both the activating trimethylated histone H3 lysine 4 (H3K4me3) mark and the repressive mark of trimethylated histone H3 lysine 27 (H3K27me3). During ovarian tumorigenesis, derepression of CLDN3 and CLDN4 expression correlates with loss of H3K27me3 in addition to trimethylated histone H4 lysine 20 (H4K20me3), another repressive histone modification. Although CLDN4 repression was accompanied by both DNA hypermethylation and repressive histone modifications, DNA methylation was not required for CLDN3 repression in immortalized ovarian epithelial cells. Moreover, activation of both CLDN3 and CLDN4 in ovarian cancer cells was associated with simultaneous changes in multiple histone modifications, whereas H3K27me3 loss alone was insufficient for their derepression. CLDN4 repression was robustly reversed by combined treatment targeting both DNA demethylation and histone acetylation. Our study strongly suggests that in addition to the well-known chromatin-associated silencing of tumor suppressor genes, epigenetic derepression by the conversely related loss of repressive chromatin modifications also contributes to ovarian tumorigenesis via activation of cancer-promoting genes or candidate oncogenes.
Figures


Similar articles
-
Claudin-4 overexpression is associated with epigenetic derepression in gastric carcinoma.Lab Invest. 2011 Nov;91(11):1652-67. doi: 10.1038/labinvest.2011.117. Epub 2011 Aug 15. Lab Invest. 2011. PMID: 21844869
-
Regulation of the CLDN3 gene in ovarian cancer cells.Cancer Biol Ther. 2007 Nov;6(11):1733-42. doi: 10.4161/cbt.6.11.4832. Epub 2007 Aug 3. Cancer Biol Ther. 2007. PMID: 17986852
-
Crucial roles of Sp1 and epigenetic modifications in the regulation of the CLDN4 promoter in ovarian cancer cells.J Biol Chem. 2006 Jul 28;281(30):21433-21444. doi: 10.1074/jbc.M603767200. Epub 2006 May 19. J Biol Chem. 2006. PMID: 16714763
-
Potential roles of claudin-3 and claudin-4 in ovarian cancer management.J Egypt Natl Canc Inst. 2022 Jun 6;34(1):24. doi: 10.1186/s43046-022-00125-4. J Egypt Natl Canc Inst. 2022. PMID: 35665865 Review.
-
Epigenetic regulation of cancer-associated genes in ovarian cancer.Int J Mol Sci. 2011 Jan 31;12(2):983-1008. doi: 10.3390/ijms12020983. Int J Mol Sci. 2011. PMID: 21541038 Free PMC article. Review.
Cited by
-
Nuclear expression of claudin-3 in human colorectal adenocarcinoma cell lines and tissues.Oncol Lett. 2018 Jan;15(1):99-108. doi: 10.3892/ol.2017.7281. Epub 2017 Oct 26. Oncol Lett. 2018. PMID: 29285188 Free PMC article.
-
Overexpression of Cancer-Associated Genes via Epigenetic Derepression Mechanisms in Gynecologic Cancer.Front Oncol. 2014 Feb 4;4:12. doi: 10.3389/fonc.2014.00012. eCollection 2014. Front Oncol. 2014. PMID: 24551595 Free PMC article. Review.
-
The histone methyltransferase SUV420H2 regulates brown and beige adipocyte thermogenesis.JCI Insight. 2024 May 7;9(11):e164771. doi: 10.1172/jci.insight.164771. JCI Insight. 2024. PMID: 38713533 Free PMC article.
-
Tight junctions in lung cancer and lung metastasis: a review.Int J Clin Exp Pathol. 2012;5(2):126-36. Epub 2012 Feb 12. Int J Clin Exp Pathol. 2012. PMID: 22400072 Free PMC article. Review.
-
Epigenomic regulation of human T-cell leukemia virus by chromatin-insulator CTCF.PLoS Pathog. 2021 May 21;17(5):e1009577. doi: 10.1371/journal.ppat.1009577. eCollection 2021 May. PLoS Pathog. 2021. PMID: 34019588 Free PMC article.
References
-
- Hanahan D, et al. The hallmarks of cancer. Cell. 2000;100:57–70. - PubMed
-
- Esteller M. Epigenetics in cancer. N. Engl. J. Med. 2008;358:1148–1159. - PubMed
-
- Esteller M. Cancer epigenomics: DNA methylomes and histone-modification maps. Nat. Rev. Genet. 2007;8:286–298. - PubMed
-
- Baylin SB, et al. Epigenetic gene silencing in cancer—a mechanism for early oncogenic pathway addiction? Nat. Rev. Cancer. 2006;6:107–116. - PubMed
-
- Gaudet F, et al. Induction of tumors in mice by genomic hypomethylation. Science. 2003;300:489–492. - PubMed
Publication types
MeSH terms
Substances
Grants and funding
LinkOut - more resources
Full Text Sources
Medical
Molecular Biology Databases

