. 2010 Jun;51(6):2976-85.
doi: 10.1167/iovs.09-4874. Epub 2010 Jan 6.

Modulation of inflammatory markers by miR-146a during replicative senescence in trabecular meshwork cells

Affiliations

Modulation of inflammatory markers by miR-146a during replicative senescence in trabecular meshwork cells

Guorong Li et al. Invest Ophthalmol Vis Sci. 2010 Jun.

Abstract

Purpose: To investigate the alterations in microRNA (miRNA) expression during replicative senescence (RS) in human trabecular meshwork (HTM) cells.

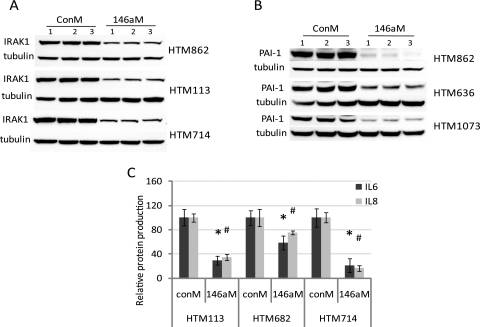
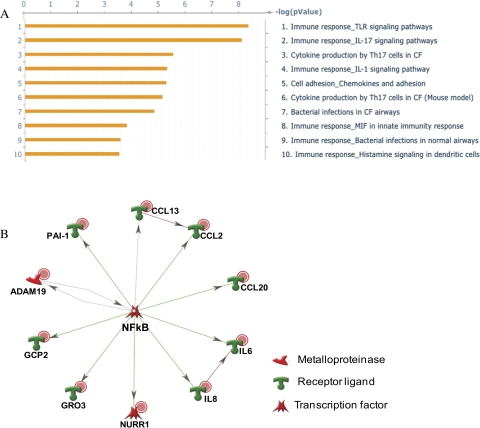
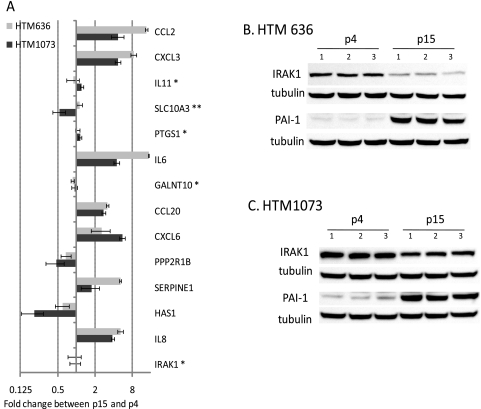
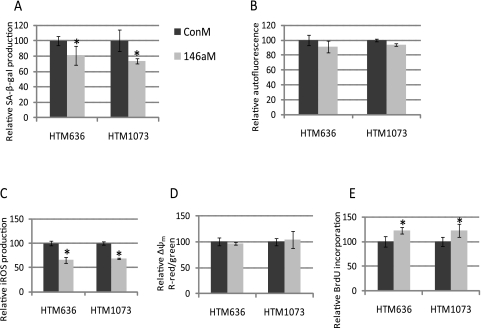
Methods: Two HTM cell lines were serially passaged until they reached RS. Changes in expression of 30 miRNAs were assessed by real-time quantitative (q)-PCR. The effects of miR-146a on gene expression were analyzed with gene arrays and the results confirmed by real-time q-PCR. Protein levels of IRAK1 and PAI-1 were analyzed by Western blot and those of IL6 and IL8 by ELISA. Senescence-associated markers were monitored by flow cytometry and cell proliferation by BrdU incorporation.

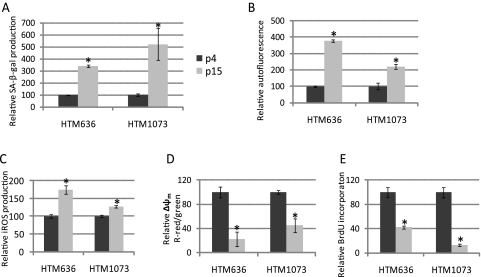
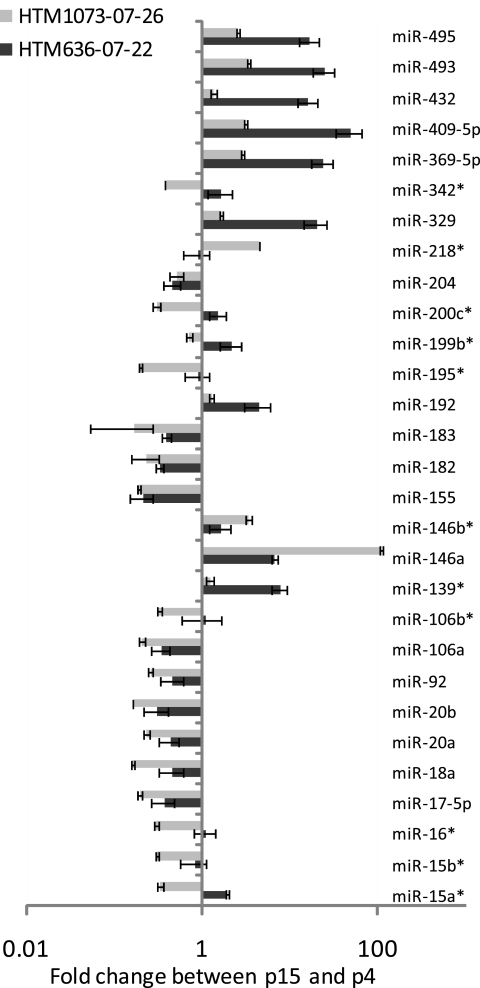
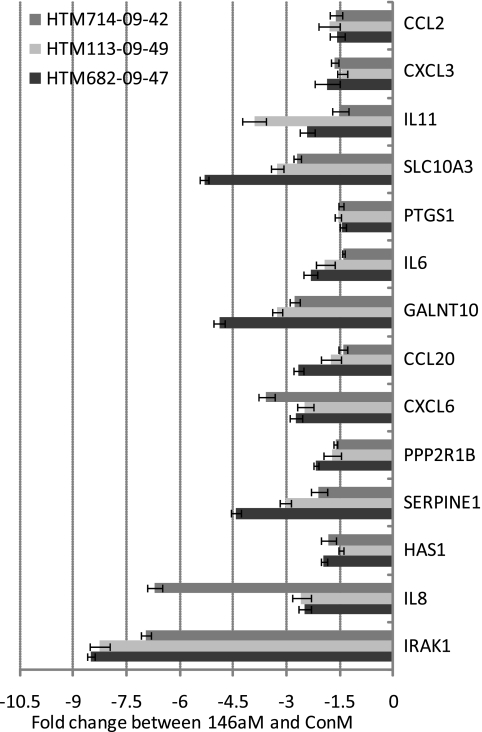
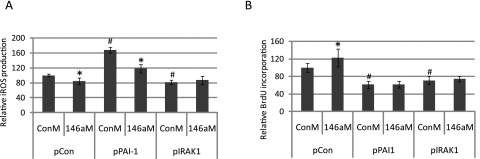
Results: RS of HTM cells was associated with significant changes in expression of 18 miRNAs, including the upregulation of miR-146a. miR-146a downregulated multiple genes associated with inflammation, including IRAK1, IL6, IL8, and PAI-1, inhibited senescence-associated beta-galactosidase (SA-beta-gal) activity and production of intracellular reactive species (iROS), and increased cell proliferation. Overexpression of either IRAK1 or PAI-1 inhibited the effects of miR-146a on cell proliferation and iROS production in senescent cells.

Conclusions: RS in HTM cells was associated with changes in miRNA expression that could influence the senescent phenotype. Upregulation of the anti-inflammatory miR-146a may serve to restrain excessive production of inflammatory mediators in senescent cells and limit their deleterious effects on the surrounding tissue. Among the different proteins repressed by miR-146a, the inhibition of PAI-1 may act to minimize the effects of senescence on the generation of iROS and growth arrest and prevent alterations of the extracellular proteolytic activity of the TM.


Figures

Figure 1.
Figure 1.
Evaluation of cellular senescence markers in two replicative senescent HTM cell lines. Two HTM (636-07-22 and 1073-07-26) cell lines showed significant expression of senescence markers at p15. Induction of SA-β-gal (A), autofluorescence (B), iROS (C), and Δψm (D) in p15 versus p4 cells was quantified by flow cytometry. The cell proliferation rate (E) was quantified by BrdU incorporation. Data represent the mean percentage change ± SD, n = 3. *P < 0.05, compared with p4 cultures; Mann–Whitney U test.
Figure 2.
Figure 2.
Changes in miRNA expression in replicative senescent HTM cells. Small RNAs (20 ng) isolated from p4 and p15 of HTM (636-07-22 and 1073-07-26, respectively) cell lines were reverse transcribed and amplified with miRNA-specific primers and probes. Relative expression was calculated by the comparative Ct method, and miRNA abundance was normalized relative to human RNU6B miRNA. Results from p15 are expressed as the change of miRNA levels relative to p4 cultures. Data represent the mean changes ± SD, n = 3. P < 0.05, compared with p4 cultures; by Mann–Whitney U test. *No significant change in one cell line.
Figure 3.
Figure 3.
Genes downregulated by miR-146a in three independent HTM cell lines. Three additional individual HTM cell lines (714-09-42, 113-09-49, and 682-09-47) were transfected with 146aM and ConM. Three days later, total RNAs were isolated, and q-PCR was performed with SYBR green master mix with specific primers (Table 1). The results were normalized with β-actin, and the gene expressions in 146aM-transfected cells were expressed as the change in levels of specific genes relative to that in ConM-transfected cells. Data represent the mean change ± SD, n = 3. P < 0.05, compared with ConM transfected cells; Mann–Whitney U test.
Figure 4.
Figure 4.
Effects of miR-146a on production of IL6, IL8, IRAK1, and PAI-1 in HTM cells. Three individual HTM cell lines were transfected with 146aM or ConM. Three days later, cell culture supernatant and total proteins were collected. IL6 and IL8 levels in cultured supernatant were measured by flow cytometry. Production of IRAK1 and PAI-1 from total protein were determined by Western blot and normalized by β-tubulin (A, B, n = 3). The percentage changes in IL6 and IL8 in 146aM transfected cells compared with their individual ConM-transfected cells. Data are expressed as the mean percentage of change ± SD, n = 3. (C) *#P < 0.05 compared with ConM transfected cells; Mann–Whitney U test.
Figure 5.
Figure 5.
Pathway analysis of the genes showing changes in expression higher than twofold with P < 0.05 in the gene microarrays. (A) The pathways identified as the more significantly affected by miR-146a at a threshold of 0.001 and P = 0.05. (B) The NF-kB transcription regulation subnetwork. NF-kB was identified as the transcription factor with the highest ranking in terms of P-value and gene ontology interpretation with 12 nodes, 11 root nodes; P-value of 7.10e-36, z-score of 129.23, and g-score of 129.23. Red dots: downregulation in the gene array analysis; green symbols: induction; red symbols: inhibition; gray arrows: unspecified interaction.
Figure 6.
Figure 6.
Identification of components of the SASP in HTM cells regulated by miR-146a. Total RNAs (500 ng) isolated from p4 and p15 of HTM cell lines (636-07-22 and 1073-07-26) were reverse transcribed and amplified with specific primers (Table 1) and SYBR green master mix. Relative expression was calculated by the comparative cycle threshold method and normalized relative to human β-actin. Results from p15 are expressed as the change in RNA levels relative to p4 cultures. Data represent the mean changes ± SD, n = 3. P < 0.05 compared with p4 cultures; Mann–Whitney U test. (A) **No significant change in one cell line; *no significant changes in any of the cell lines. Total proteins were isolated from p4 and p15 of HTM cells lines (B) 636-07-22 and (C) 1073-07-26), n = 3. Western blot analysis was conducted with 8% SDS PAGE, and the membrane was stained with IRAK1- and PAI-1-specific antibodies. The same membrane was stripped and restained with β-tubulin (B, C).
Figure 7.
Figure 7.
Effects of miR-146a on the expression of cellular senescence markers in HTM cells. Two HTM (636-07-22 and 1073-07-26) cell lines p11 transfected with 146aM or ConM. Induction of SA-β-gal (A), autofluorescence (B), iROS (C), Δψm (D) in 146aM-transfected cells (146aM) versus ConM-transfected cells (ConM) were quantified by flow cytometry. The proliferation rate (E) was quantified by BrdU incorporation. Data show the percentage of increase or decrease compared with their individual ConM-transfected cells and represent the mean percentage change ± SD, n = 3. *P < 0.05, compared with ConM-transfected cells; Mann–Whitney U test.
Figure 8.
Figure 8.
Role of PAI-1 and IRAK1 on the effects of miR-146a on the production of iROS and BrdU incorporation. Presenescent HTM cells at p11 were cotransfected with 2 μg of either a negative control plasmid (pCon), a plasmid expressing PAI-1 (pPAI-1), or a plasmid expressing IRAK1 (pIRAK1, which lacked the 3′UTR that contains the target site for miR-146a) and 120 pmol of either a miR-146a mimic (146aM) or a scrambled miRNA used as a negative control (ConM). Three days after transfection, production of iROS was determined by DCFH oxidation, and cell proliferation was measured by BrdU incorporation. (A) Comparison cells cotransfected with pPAI-1/ConM with those cotransfected with pCon/ConM showed that overexpression of PAI-1 resulted in an increase of almost twofold in the generation of iROS. However, a comparison between cells cotransfected with pPAI-1/146aM or pPAI-1/ConM showed that miR-146 decreased the production of iROS in cells overexpressing PAI-1. In contrast, expression of IRAK1 lacking the 3′UTR prevented completely the decrease in iROS production mediated by miR-146a. (B) Overexpression of either PAI-1 or IRAK1 lacking the 3′UTR prevented the increase in cell proliferation induced by miR-146a. Data represent the mean percentage changes ± SD, n = 3–4. *#P < 0.05, compared with ConM+pCon by Mann–Whitney U test.

Similar articles

Cited by

References

    1. Li G, Luna C, Liton PB, Navarro I, Epstein DL, Gonzalez P. Sustained stress response after oxidative stress in trabecular meshwork cells. Mol Vis 2007;13:2282–2288 - PMC - PubMed
    1. Liton PB, Luna C, Challa P, Epstein DL, Gonzalez P. Genome-wide expression profile of human trabecular meshwork cultured cells, nonglaucomatous and primary open angle glaucoma tissue. Mol Vis 2006;12:774–790 - PMC - PubMed
    1. Wang N, Chintala SK, Fini ME, Schuman JS. Activation of a tissue-specific stress response in the aqueous outflow pathway of the eye defines the glaucoma disease phenotype. Nat Med 2001;7:304–309 - PMC - PubMed
    1. Xu H, Chen M, Forrester JV. Para-inflammation in the aging retina. Prog Retin Eye Res 2009;28:348–368 - PubMed
    1. Aikata H, Takaishi H, Kawakami Y, et al. Telomere reduction in human liver tissues with age and chronic inflammation. Exp Cell Res 2000;256:578–582 - PubMed

Publication types

MeSH terms