. 2010 Mar 12;285(11):8278-89.
doi: 10.1074/jbc.M109.005967. Epub 2010 Jan 6.

Sucrose octasulfate selectively accelerates thrombin inactivation by heparin cofactor II

Affiliations

Sucrose octasulfate selectively accelerates thrombin inactivation by heparin cofactor II

Suryakala Sarilla et al. J Biol Chem. .

Abstract

Inactivation of thrombin (T) by the serpins heparin cofactor II (HCII) and antithrombin (AT) is accelerated by a heparin template between the serpin and thrombin exosite II. Unlike AT, HCII also uses an allosteric interaction of its NH(2)-terminal segment with exosite I. Sucrose octasulfate (SOS) accelerated thrombin inactivation by HCII but not AT by 2000-fold. SOS bound to two sites on thrombin, with dissociation constants (K(D)) of 10 +/- 4 microm and 400 +/- 300 microm that were not kinetically resolvable, as evidenced by single hyperbolic SOS concentration dependences of the inactivation rate (k(obs)). SOS bound HCII with K(D) 1.45 +/- 0.30 mm, and this binding was tightened in the T.SOS.HCII complex, characterized by K(complex) of approximately 0.20 microm. Inactivation data were incompatible with a model solely depending on HCII.SOS but fit an equilibrium linkage model employing T.SOS binding in the pathway to higher order complex formation. Hirudin-(54-65)(SO(3)(-)) caused a hyperbolic decrease of the inactivation rates, suggesting partial competitive binding of hirudin-(54-65)(SO(3)(-)) and HCII to exosite I. Meizothrombin(des-fragment 1), binding SOS with K(D) = 1600 +/- 300 microm, and thrombin were inactivated at comparable rates, and an exosite II aptamer had no effect on the inactivation, suggesting limited exosite II involvement. SOS accelerated inactivation of meizothrombin 1000-fold, reflecting the contribution of direct exosite I interaction with HCII. Thrombin generation in plasma was suppressed by SOS, both in HCII-dependent and -independent processes. The ex vivo HCII-dependent process may utilize the proposed model and suggests a potential for oversulfated disaccharides in controlling HCII-regulated thrombin generation.


Figures

SCHEME 1.
SCHEME 1.
Individual pathway contributions to formation of higher order reversible complexes preceding covalent inactivation.
FIGURE 1.
FIGURE 1.
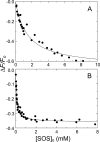
Fluorescence equilibrium binding of SOS to HCII and AT bound to TNS. A, fractional change in fluorescence (ΔF/Fo) of 500 nm HCII and 12 μm TNS as a function of total SOS concentration ([SOS]o). B, fractional change in fluorescence (ΔF/Fo) of 3.7 and 4.5 μm AT and 12 μm TNS as a function of total SOS concentration. Solid lines, least squares fitting of the data by the quadratic equation for binding of a single ligand, with parameters KHCII(SOS) and KAT(SOS) given under “Experimental Procedures,” ΔFmax,HCII(SOS)/Fo = −67 ± 5%, and ΔFmax,AT(SOS)/Fo = −36 ± 1%. Binding experiments were analyzed as described under “Experimental Procedures.”
FIGURE 2.
FIGURE 2.
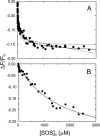
Fluorescence equilibrium binding of SOS to [ANS]FPR-T and [ANS]FPR-Mz(-F1). A, fractional change in fluorescence (ΔF/Fo) of 390 nm [ANS]FPR-T as a function of total SOS concentration ([SOS]o). Solid lines, least squares fits of the data by Equation 1, with the parameters KT(SOS) and KT(SOS)2 listed under “Results.” Dashed lines, fitting by the quadratic equation for binding of a single ligand, with or without a nonspecific term. B, fractional change in fluorescence (ΔF/Fo) of 343 nm [ANS]FPR-Mz(-F1) as a function of total SOS concentration. Solid lines, least squares fits of the data by the quadratic equation for binding of a single ligand. Binding experiments were analyzed as described under “Experimental Procedures.”
FIGURE 3.
FIGURE 3.
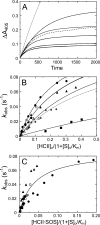
HCII concentration dependences of the inactivation kinetics. A, an array of progress curves for inactivation of 0.5 nm thrombin (solid lines) by 166 nm HCII, in the presence of Chromozym TH (156 μm) and increasing concentrations of SOS (in order of decreasing amplitude: 170, 345, 430, 600 and 2000 μm). Dashed line, a reaction of 4 nm stable MzT with 166 nm HCII, at 156 μm Chromozym TH and 2000 μm SOS. Dotted line, a thrombin control reaction with 166 nm HCII, at 156 μm Chromozym TH and 20 mm Na2SO4. B, first-order inactivation rate constants (kobs) as a function of effective total HCII concentration ([HCII]o/(1 + [S]o/Km)), at 2500 μm (●), 207 μm (▴), and 50 μm SOS (■) and 156 μm Chromozym TH; 500 μm SOS (○) and 198 μm Chromozym TH; or 500 μm SOS (▵) and 200 μm S2238. Solid lines represent global least squares fitting of the combined data by Equation 5, with the parameters listed under “Results.” Data for Mz(-F1) inactivation at 518 μm SOS and 156 μm Chromozym TH are indicated by asterisks. C, first-order inactivation rate constants (kobs) for the same data sets in B, as a function of effective HCII·SOS concentration ([HCII·SOS]/(1 + [S]o/Km)), without equilibrium linkage and SOS binding to thrombin. Experiments were analyzed as described under “Experimental Procedures.”
FIGURE 4.
FIGURE 4.
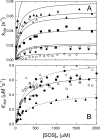
SOS concentration dependences of the inactivation kinetics. A, first-order inactivation rate constants (kobs) as a function of total SOS ([SOS]o) concentration, at various fixed HCII and chromogenic substrate concentrations: 553 nm (●), 277 nm (○), 197 nm (▴), 166 nm (▵), 98 nm (■), 45 nm HCII (□), and 150 μm CBS31.39; 415 nm (♦) and 166 nm HCII (◇); and 157 μm Chromozym TH. Solid lines, global least squares fitting of the combined data by Equation 5, with the parameters KT(SOS)app, Kcomplex, klim, and KHCII(SOS) given under “Results.” B, the apparent second-order rate constant (k′) for thrombin inactivation by HCII as a function of total SOS concentration, obtained from reactions in the presence of Chromozym TH (●) and CBS31.39 (○), and for Mz(-F1) (▵) and MzT (▴) inactivation in the presence of Chromozym TH or CBS31.39. Solid (T), dotted (Mz(-F1)), and dashed lines (MzT), least squares fitting of the data by Equation 6, with parameters given under “Results.” Experiments were analyzed as described under “Experimental Procedures.”
FIGURE 5.
FIGURE 5.
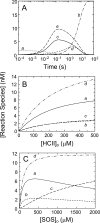
Individual contributions of SOS-bound species to higher order complex formation, based on numerical integration. A, time scale showing disappearance of free thrombin (trace a) and generation of covalent complex (trace b) in addition to generation of intermediate complex from T·SOS and HCII (trace c), from HCII·SOS and T (trace d), and from T·SOS and HCII·SOS (trace e). SOS, thrombin, and HCII concentrations were 2500 μm, 20 nm, and 1 μm, respectively. B, HCII dependences of the higher order complexes of SOS, thrombin, and HCII ([Reaction species]) formed from T·SOS and HCII (trace a), from HCII·SOS and T (trace b), and from T·SOS and HCII·SOS (trace c) and the sum of the three pathways (trace d). Thrombin and SOS concentrations were 27 nm and 500 μm, respectively. C, SOS dependences of the higher order complexes of SOS, thrombin, and HCII formed from T·SOS and HCII (trace a), from HCII·SOS and T (trace b), and from T·SOS and HCII·SOS (trace c) and the sum of the three pathways (trace d). Thrombin and HCII concentrations were 27 and 166 nm, respectively. All forward rate constants were 32 μm−1 s−1; KT(SOS)app was 200 μm; Kcomplex was 0.12 μm, representing both k−2/k+2 and k−5/k+5; KHCII(SOS) was 1.45 mm; KHCII·SOS(T) was 0.028 μm, as a result of the equilibrium linkage. The chemical step, klim = 0.12 s−1, determined covalent T-HCII complex formation.
FIGURE 6.
FIGURE 6.
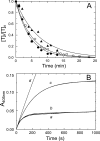
Selectivity of SOS for thrombin inactivation by HCII. A, fractional thrombin activity ([T]t/[T]o) as a function of time is shown for reactions of 500 nm AT and 50 nm T, in the absence (●), and the presence of 50 μm (○), and 500 μm (▴) SOS. Solid lines, fit of the data by a single exponential. Values for k′ for each reaction are given under “Results.” B, progress curves for inactivation of 0.6 nm fXa by 65 nm AT in the presence of Spectrozyme fXa (160 μm) and fondaparinux (500 nm). Reactions were performed in the absence (a) and the presence of 200 μm (b) and 2000 μm (c) SOS. The control reaction (d) had 2000 μm SOS and no fondaparinux. Solid lines, nonlinear least squares fits of the data by Equations 2–4. Inactivation reactions were analyzed as described under “Experimental Procedures.”
FIGURE 7.
FIGURE 7.
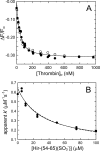
Effect of Hir-(54–65)(SO3) on thrombin inactivation by HCII. A, fractional change in fluorescence (ΔF/Fo) of 29 nm [5F]Hir-(54–65)(SO3) as a function of total thrombin concentration ([Thrombin]o). Solid lines, least squares fits by the quadratic equation for binding of a single ligand, with ΔFmax,T(Hir)/Fo and KT(Hir) given under “Results” for titrations in the absence (●) and presence (○) of 518 μm SOS. B, dependence of the apparent bimolecular rate constant (k′) on the total concentration of Hir-(54–65)(SO3). Solid line, least squares fit of the data by Equation 7 combined with the quadratic binding equation for Hir-(54–65)(SO3) binding to T·SOS, with the fitted parameters k′ and kT·SOS(Hir)− listed under “Results.” Dashed line, fit by the purely competitive model for binding of peptide and HCII to exosite I. Experiments were analyzed as described under “Experimental Procedures.”
FIGURE 8.
FIGURE 8.
SOS-mediated inhibition of thrombin generation and effect of anti-HCII antibodies. A, thrombin generation ([Thrombin]) in PNP, triggered by 3 nm fXa, in the presence of 0, 100, 200, 350, 500, and 1000 μm SOS (traces a–f). Inset, endogenous thrombin potential (ETP) as a function of total SOS concentration in the plasma ([SOS]o). The solid line represents the least squares fit of the data by Equation 8, with the fitted parameters ETPo = 2100 ± 100 nm and A = 160 ± 20 μm. B, thrombin generation triggered by 16 pm TF, in the presence of 0, 10, 100, 500, 1000, and 5000 μm SOS (traces a–f). Inset, ETP as a function of total SOS concentration in the plasma ([SOS]o). Fitted parameters were ETPo = 1470 ± 40 nm and A = 200 ± 30 μm. C, thrombin generation triggered by 16 pm TF, at 0 μm SOS, in the absence (trace a) and the presence (trace b) of 6 μm goat anti-human HCII antibody, and at 2000 μm SOS, in the absence (trace c) and presence (trace d) of antibody. D, thrombin generation triggered by 16 pm TF, at 0 μm SOS, in the absence (trace a) and the presence (trace b) of 6 μm sheep anti-human HCII antibody, and at 1000 and 5000 μm SOS, in the absence (trace c) and presence (traces d and e) of antibody. CAT assays were analyzed as described under “Experimental Procedures.”
FIGURE 9.
FIGURE 9.
Effect of SOS on thrombin generation in HCII-depleted plasma and in a purified system. A, thrombin generation ([Thrombin]) in HCII-depleted plasma, triggered by 3 nm fXa, at 0, 250, and 500 μm SOS (traces a–c), and at 0.5 and 1 μm heparin-free DS (traces d and e, dotted lines). B, thrombin generation triggered by 16 pm TF, at 0, 10, 100, 500, and 1000 μm SOS (traces a–e). Inset, ETP as a function of total SOS concentration in the plasma ([SOS]o). C, thrombin generation triggered by 3 nm fXa, in the absence of SOS, and in the absence (trace a) and presence (trace b) of 1.3 μm supplemented purified plasma HCII. Traces c–g are in the presence of 250 μm SOS, at 0, 0.67, 1.3, 2.6, and 3.9 μm HCII, respectively. Inset, ETP for reactions a–g. CAT assays were analyzed as described under “Experimental Procedures.” D, in vitro prothrombin activation, in the absence (trace a) and presence of 600 μm SOS, as described under “Experimental Procedures.”

Similar articles

Cited by

References

    1. Olson S. T. (1988) J. Biol. Chem. 263, 1698–1708 - PubMed
    1. Tollefsen D. M., Pestka C. A., Monafo W. J. (1983) J. Biol. Chem. 258, 6713–6716 - PubMed
    1. Van Deerlin V. M., Tollefsen D. M. (1991) J. Biol. Chem. 266, 20223–20231 - PubMed
    1. Rogers S. J., Pratt C. W., Whinna H. C., Church F. C. (1992) J. Biol. Chem. 267, 3613–3617 - PubMed
    1. Church F. C., Meade J. B., Treanor R. E., Whinna H. C. (1989) J. Biol. Chem. 264, 3618–3623 - PubMed

Publication types

MeSH terms