

Crystal structure of the Mp1p ligand binding domain 2 reveals its function as a fatty acid-binding protein
- PMID: 20053994
- PMCID: PMC2838340
- DOI: 10.1074/jbc.M109.057760
Crystal structure of the Mp1p ligand binding domain 2 reveals its function as a fatty acid-binding protein
Abstract
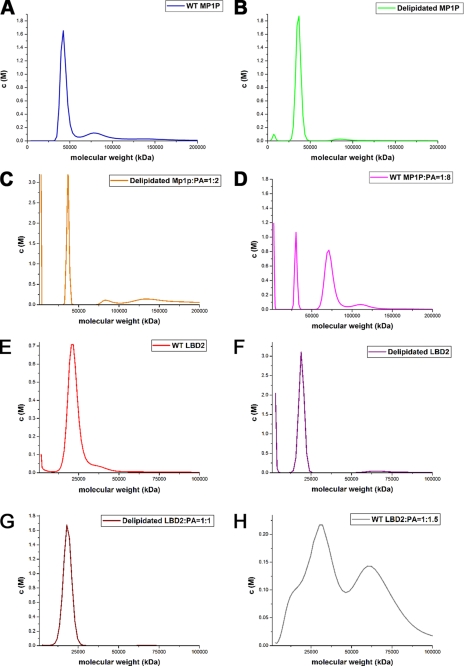
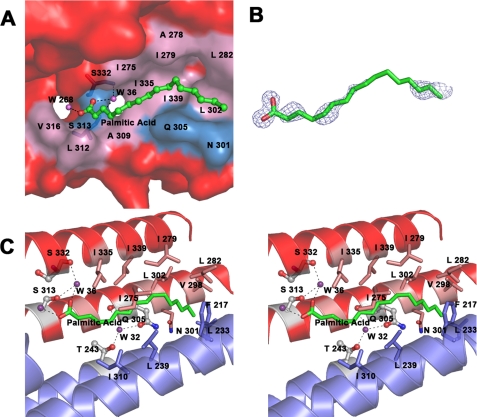
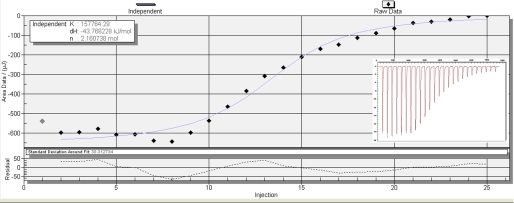
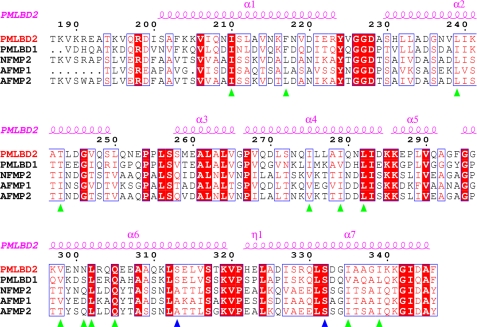
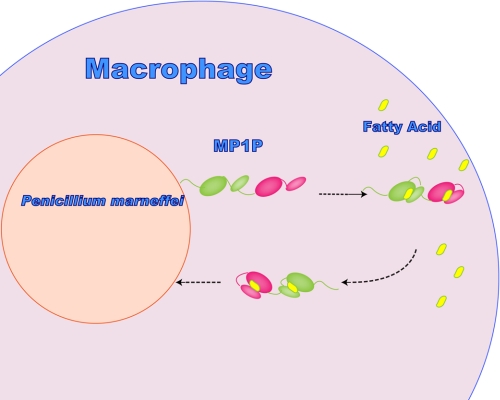
Penicillium marneffei is a dimorphic, pathogenic fungus in Southeast Asia that mostly afflicts immunocompromised individuals. As the only dimorphic member of the genus, it goes through a phase transition from a mold to yeast form, which is believed to be a requisite for its pathogenicity. Mp1p, a cell wall antigenic mannoprotein existing widely in yeast, hyphae, and conidia of the fungus, plays a vital role in host immune response during infection. To understand the function of Mp1p, we have determined the x-ray crystal structure of its ligand binding domain 2 (LBD2) to 1.3 A. The structure reveals a dimer between the two molecules. The dimer interface forms a ligand binding cavity, in which electron density was observed for a palmitic acid molecule interacting with LBD2 indirectly through hydrogen bonding networks via two structural water molecules. Isothermal titration calorimetry experiments measured the ligand binding affinity (K(d)) of Mp1p at the micromolar level. Mutations of ligand-binding residues, namely S313A and S332A, resulted in a 9-fold suppression of ligand binding affinity. Analytical ultracentrifugation assays demonstrated that both LBD2 and Mp1p are mostly monomeric in vitro, no matter with or without ligand, and our dimeric crystal structure of LBD2 might be the result of crystal packing. Based on the conformation of the ligand-binding pocket in the dimer structure, a model for the closed, monomeric form of LBD2 is proposed. Further structural analysis indicated the biological importance of fatty acid binding of Mp1p for the survival and pathogenicity of the conditional pathogen.
Figures
Similar articles
-
MP1 encodes an abundant and highly antigenic cell wall mannoprotein in the pathogenic fungus Penicillium marneffei.Infect Immun. 1998 Mar;66(3):966-73. doi: 10.1128/IAI.66.3.966-973.1998. Infect Immun. 1998. PMID: 9488383 Free PMC article.
-
Talaromyces marneffei Mp1 Protein, a Novel Virulence Factor, Carries Two Arachidonic Acid-Binding Domains To Suppress Inflammatory Responses in Hosts.Infect Immun. 2019 Mar 25;87(4):e00679-18. doi: 10.1128/IAI.00679-18. Print 2019 Apr. Infect Immun. 2019. PMID: 30670555 Free PMC article.
-
Talaromyces marneffei Mp1p Is a Virulence Factor that Binds and Sequesters a Key Proinflammatory Lipid to Dampen Host Innate Immune Response.Cell Chem Biol. 2017 Feb 16;24(2):182-194. doi: 10.1016/j.chembiol.2016.12.014. Epub 2017 Jan 19. Cell Chem Biol. 2017. PMID: 28111099
-
Immunoassays based on Penicillium marneffei Mp1p derived from Pichia pastoris expression system for diagnosis of penicilliosis.PLoS One. 2011;6(12):e28796. doi: 10.1371/journal.pone.0028796. Epub 2011 Dec 21. PLoS One. 2011. PMID: 22205971 Free PMC article.
-
Evolution of the ability to evade host innate immune defense by Talaromyces marneffei.Int J Biol Macromol. 2023 Dec 31;253(Pt 8):127597. doi: 10.1016/j.ijbiomac.2023.127597. Epub 2023 Oct 25. Int J Biol Macromol. 2023. PMID: 37884245
Cited by
-
Mp1p Is a Virulence Factor in Talaromyces (Penicillium) marneffei.PLoS Negl Trop Dis. 2016 Aug 25;10(8):e0004907. doi: 10.1371/journal.pntd.0004907. eCollection 2016 Aug. PLoS Negl Trop Dis. 2016. PMID: 27560160 Free PMC article.
-
Talaromyces marneffei Genomic, Transcriptomic, Proteomic and Metabolomic Studies Reveal Mechanisms for Environmental Adaptations and Virulence.Toxins (Basel). 2017 Jun 13;9(6):192. doi: 10.3390/toxins9060192. Toxins (Basel). 2017. PMID: 28608842 Free PMC article. Review.
-
Novel Insights into the Antimicrobial and Antibiofilm Activity of Pyrroloquinoline Quinone (PQQ); In Vitro, In Silico, and Shotgun Proteomic Studies.Biomolecules. 2024 Aug 16;14(8):1018. doi: 10.3390/biom14081018. Biomolecules. 2024. PMID: 39199405 Free PMC article.
-
Excavation of Biomarker Candidates for the Diagnosis of Talaromyces marneffei Infection via Genome-Wide Prediction and Functional Annotation of Secreted Proteins.ACS Omega. 2024 Jun 13;9(25):27093-27103. doi: 10.1021/acsomega.4c00571. eCollection 2024 Jun 25. ACS Omega. 2024. PMID: 38947822 Free PMC article.
-
RNA-Seq of in planta-expressed Magnaporthe oryzae genes identifies MoSVP as a highly expressed gene required for pathogenicity at the initial stage of infection.Mol Plant Pathol. 2019 Dec;20(12):1682-1695. doi: 10.1111/mpp.12869. Epub 2019 Sep 27. Mol Plant Pathol. 2019. PMID: 31560822 Free PMC article.
References
-
- Yuen K. Y., Pascal G., Wong S. S., Glaser P., Woo P. C., Kunst F., Cai J. J., Cheung E. Y., Médigue C., Danchin A. (2003) Arch. Microbiol. 179, 339–353 - PubMed
Publication types
MeSH terms
Substances
LinkOut - more resources
Full Text Sources
Other Literature Sources
Molecular Biology Databases
Research Materials
