

Conformational changes induced in voltage-gated calcium channel Cav1.2 by BayK 8644 or FPL64176 modify the kinetics of secretion independently of Ca2+ influx
- PMID: 20054004
- PMCID: PMC2844149
- DOI: 10.1074/jbc.M109.059865
Conformational changes induced in voltage-gated calcium channel Cav1.2 by BayK 8644 or FPL64176 modify the kinetics of secretion independently of Ca2+ influx
Abstract
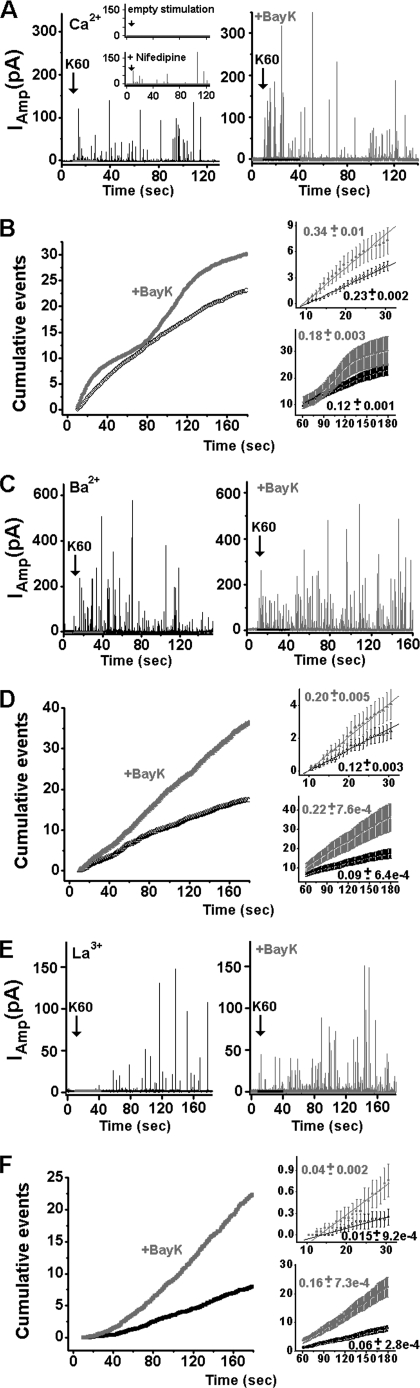
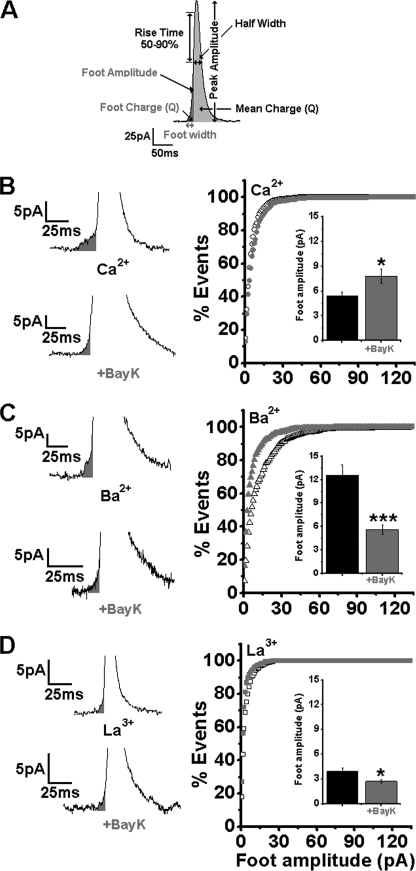
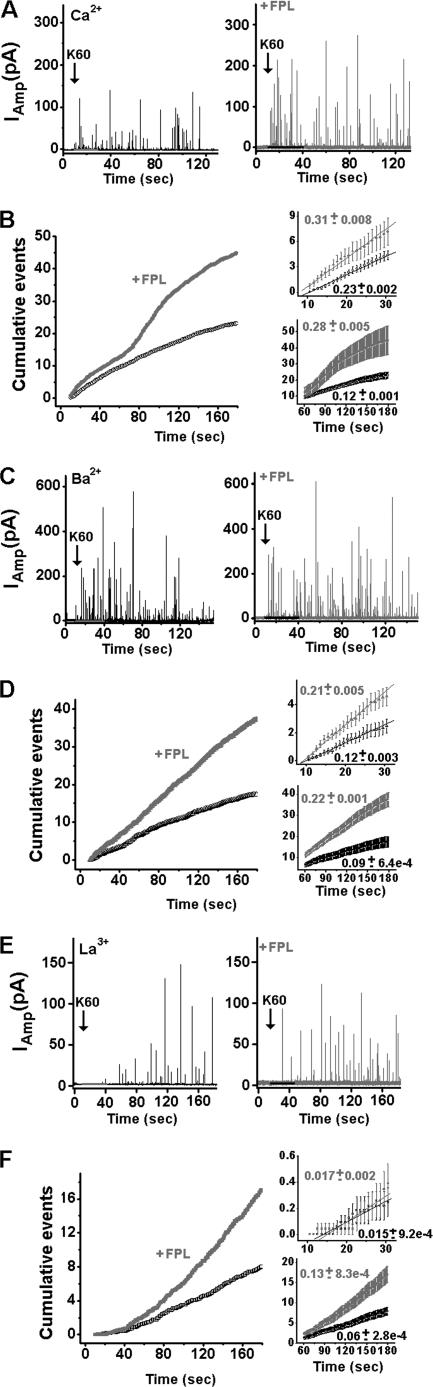
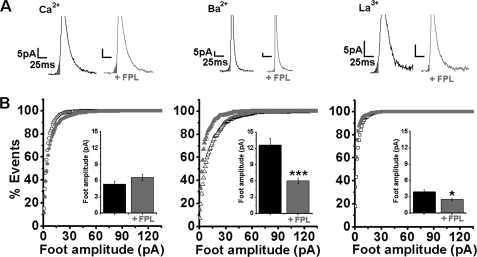
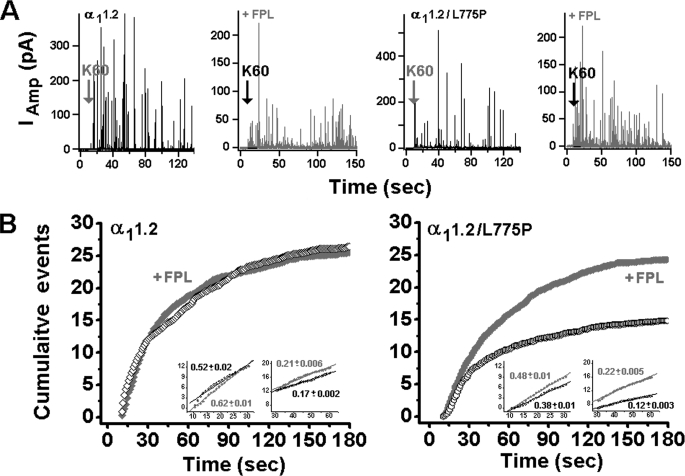
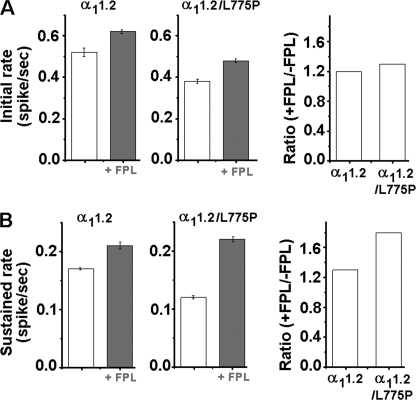
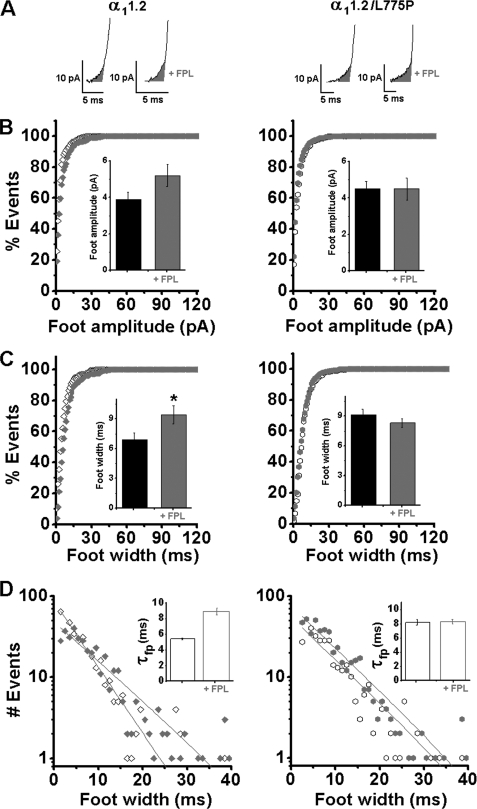
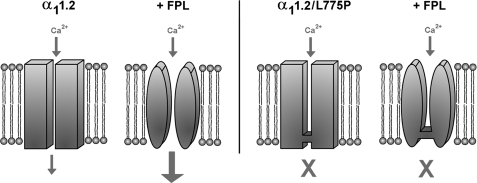
The role of the L-type calcium channel (Cav1.2) as a molecular switch that triggers secretion prior to Ca(2+) transport has previously been demonstrated in bovine chromaffin cells and rat pancreatic beta cells. Here, we examined the effect of specific Cav1.2 allosteric modulators, BayK 8644 (BayK) and FPL64176 (FPL), on the kinetics of catecholamine release, as monitored by amperometry in single bovine chromaffin cells. We show that 2 microm BayK or 0.5 microm FPL accelerates the rate of catecholamine secretion to a similar extent in the presence either of the permeable Ca(2+) and Ba(2+) or the impermeable charge carrier La(3+). These results suggest that structural rearrangements generated through the binding of BayK or FPL, by altering the channel activity, could affect depolarization-evoked secretion prior to cation transport. FPL also accelerated the rate of secretion mediated by a Ca(2+)-impermeable channel made by replacing the wild type alpha(1)1.2 subunit was replaced with the mutant alpha(1)1.2/L775P. Furthermore, BayK and FPL modified the kinetic parameters of the fusion pore formation, which represent the initial contact between the vesicle lumen and the extracellular medium. A direct link between the channel activity and evoked secretion lends additional support to the view that the voltage-gated Ca(2+) channels act as a signaling molecular switch, triggering secretion upstream to ion transport into the cell.
Figures
Similar articles
-
Loss of Cav1.3 channels reveals the critical role of L-type and BK channel coupling in pacemaking mouse adrenal chromaffin cells.J Neurosci. 2010 Jan 13;30(2):491-504. doi: 10.1523/JNEUROSCI.4961-09.2010. J Neurosci. 2010. PMID: 20071512 Free PMC article.
-
Multiple calcium channels are required for pituitary adenylate cyclase-activating polypeptide-induced catecholamine secretion from bovine cultured adrenal chromaffin cells.Naunyn Schmiedebergs Arch Pharmacol. 1997 Nov;356(5):536-42. doi: 10.1007/pl00005088. Naunyn Schmiedebergs Arch Pharmacol. 1997. PMID: 9402032
-
Transmission of information from cardiac dihydropyridine receptor to ryanodine receptor: evidence from BayK 8644 effects on resting Ca(2+) sparks.Circ Res. 2000 Jul 21;87(2):106-11. doi: 10.1161/01.res.87.2.106. Circ Res. 2000. PMID: 10903993
-
CaV1.3 as pacemaker channels in adrenal chromaffin cells: specific role on exo- and endocytosis?Channels (Austin). 2010 Nov-Dec;4(6):440-6. doi: 10.4161/chan.4.6.12866. Epub 2010 Nov 1. Channels (Austin). 2010. PMID: 21084859 Review.
-
Direct Estimation of CaV1.2 Gating Parameters: Quantification of Voltage Sensor - Pore Transductions and their Modulation by FLP 64176.Curr Mol Pharmacol. 2015;8(1):87-94. doi: 10.2174/1874467208666150507100256. Curr Mol Pharmacol. 2015. PMID: 25966699 Review.
Cited by
-
Intra-membrane signaling between the voltage-gated Ca2+-channel and cysteine residues of syntaxin 1A coordinates synchronous release.Sci Rep. 2013;3:1620. doi: 10.1038/srep01620. Sci Rep. 2013. PMID: 23567899 Free PMC article.
-
Hydroxyl Group and Vasorelaxant Effects of Perillyl Alcohol, Carveol, Limonene on Aorta Smooth Muscle of Rats.Molecules. 2018 Jun 13;23(6):1430. doi: 10.3390/molecules23061430. Molecules. 2018. PMID: 29899230 Free PMC article.
-
Non-ionotropic voltage-gated calcium channel signaling.Channels (Austin). 2024 Dec;18(1):2341077. doi: 10.1080/19336950.2024.2341077. Epub 2024 Apr 11. Channels (Austin). 2024. PMID: 38601983 Free PMC article. Review.
-
The physiology of regulated BDNF release.Cell Tissue Res. 2020 Oct;382(1):15-45. doi: 10.1007/s00441-020-03253-2. Epub 2020 Sep 18. Cell Tissue Res. 2020. PMID: 32944867 Free PMC article. Review.
-
Control of depolarization-evoked presynaptic neurotransmitter release by Cav2.1 calcium channel: old story, new insights.Channels (Austin). 2010 Nov-Dec;4(6):431-3. doi: 10.4161/chan.4.6.13613. Epub 2010 Nov 1. Channels (Austin). 2010. PMID: 20935476 Free PMC article.
References
-
- Peterson B. Z., Catterall W. A. (2006) Mol. Pharmacol. 70, 667–675 - PubMed
-
- Hess P., Lansman J. B., Tsien R. W. (1984) Nature 311, 538–544 - PubMed
-
- Baxter A. J., Dixon J., Ince F., Manners C. N., Teague S. J. (1993) J. Med. Chem. 36, 2739–2744 - PubMed
-
- Peterson B. Z., Catterall W. A. (1995) J. Biol. Chem. 270, 18201–18204 - PubMed
Publication types
MeSH terms
Substances
LinkOut - more resources
Full Text Sources
Other Literature Sources
Miscellaneous
