. 2010 Feb;20(2):281-90.
doi: 10.1101/gr.099234.109. Epub 2010 Jan 6.

A high-resolution association mapping panel for the dissection of complex traits in mice

Affiliations

A high-resolution association mapping panel for the dissection of complex traits in mice

Brian J Bennett et al. Genome Res. 2010 Feb.

Abstract

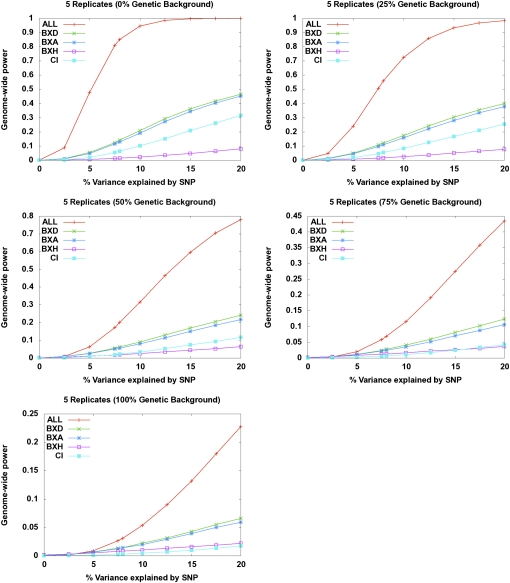
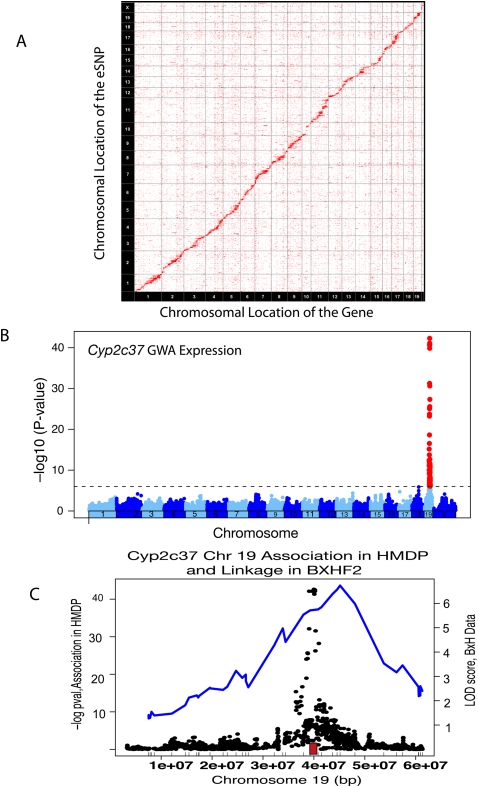
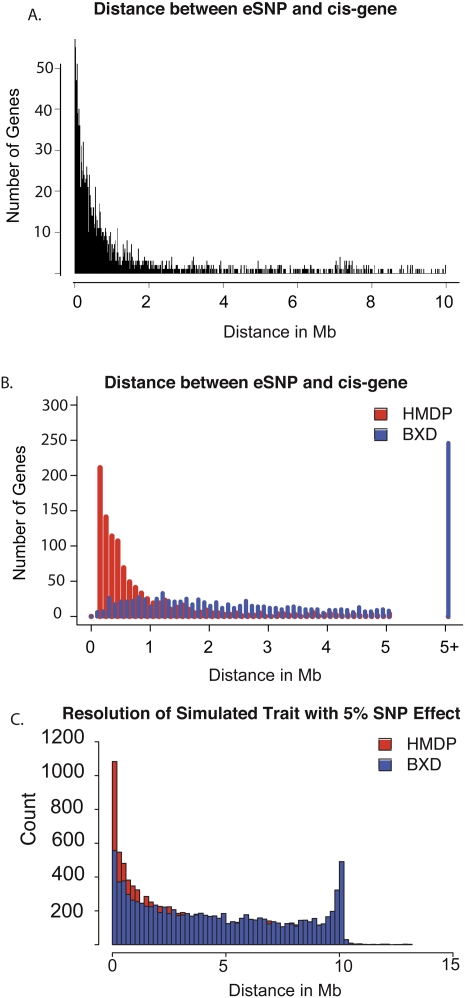
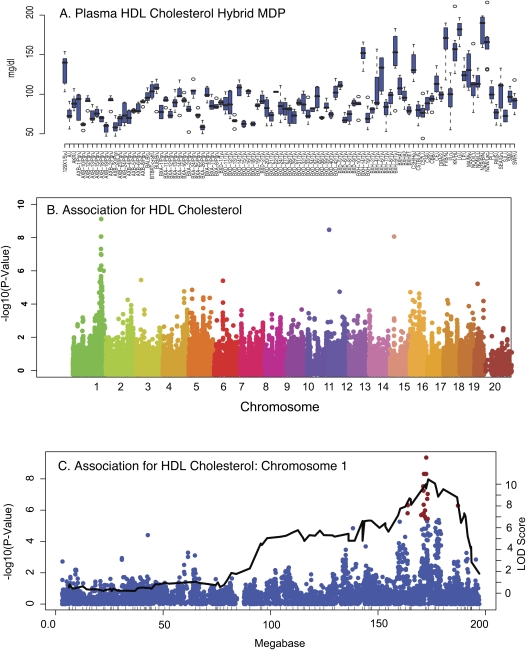
Systems genetics relies on common genetic variants to elucidate biologic networks contributing to complex disease-related phenotypes. Mice are ideal model organisms for such approaches, but linkage analysis has been only modestly successful due to low mapping resolution. Association analysis in mice has the potential of much better resolution, but it is confounded by population structure and inadequate power to map traits that explain less than 10% of the variance, typical of mouse quantitative trait loci (QTL). We report a novel strategy for association mapping that combines classic inbred strains for mapping resolution and recombinant inbred strains for mapping power. Using a mixed model algorithm to correct for population structure, we validate the approach by mapping over 2500 cis-expression QTL with a resolution an order of magnitude narrower than traditional QTL analysis. We also report the fine mapping of metabolic traits such as plasma lipids. This resource, termed the Hybrid Mouse Diversity Panel, makes possible the integration of multiple data sets and should prove useful for systems-based approaches to complex traits and studies of gene-by-environment interactions.


Figures

Figure 1.
Figure 1.
Power calculations. We estimated the power for the 29 inbred strains, the individual RI panels (BXD, AXB/BXA, and BXH) and the combined HMDP. Simulations assume five replicates per strain. The x-axis indicates increasing effect size of SNP, and the y-axis is estimated power. Each panel represents simulations performed under different scenarios in which the genetic background (or population structure effect) accounts for an increasing proportion of the total variance of the phenotype.
Figure 2.
Figure 2.
Expression SNPs from HMDP. (A) Transcript levels in liver of HMDP mice were profiled and significant associations are plotted according to chromosomal position (x-axis) versus the location of the structural gene (y-axis). The strong diagonal line represents cis-eQTL, whereas the remainder are trans-eQTL signals. (B) Genome-wide association results in the HMDP demonstrating a strong association for Cyp2c37 transcript levels in liver on chromosome 19. (C) Chromosome 19 specifically, with an overlay between the linkage results from the BXHApoe−/− F2 cross and the association from the HMDP panel for the Cyp2c37 cis-eQTL on chromosome 19. (Red box) The location of Cyp2c37. The tick marks on the x-axis are the location of the chromosome 19 markers used in the BXHApoe−/− F2 intercross.
Figure 3.
Figure 3.
Expression traits demonstrate high resolution of HMDP. (A) Distance between peak cis-eQTL and the transcription start site of the corresponding gene in the HMDP. The majority of cis-eQTL map within 500 kb of the transcription start site of the corresponding gene. (B) Comparison of resolution in the full HMDP (red bars) to BXD recombinant inbred panel (blue bars) showing 1000 cis-eQTL in both populations. (C) Simulated resolution of a SNP with 5% effect in the HMDP (red bars) and BXD recombinant inbred panel (blue bars).
Figure 4.
Figure 4.
Detection of associations for plasma lipids in HMDP strains coincide with a corresponding QTL in C57BL/6 × C3H/HeJ F2 crosses. Six to ten mice of each strain were examined for the given phenotypes as described in Methods. (A) Plasma HDL levels in the HMDP. (B) GWAS for plasma high-density lipoprotein cholesterol. (C) Comparison of association results with linkage results on chromosome 1. Linkage data from a previously reported F2 cross between C3H/HeJ and C57BL/6J (Wang et al. 2007). These results demonstrate the power of the HMDP to detect associations for QTL observed in the F2 cross, and also highlight the vastly improved resolution of association testing with the HMDP.
Figure 5.
Figure 5.
Linkage disequilibrium in the HMDP. The average r2 for marker pairs was calculated per chromosome and the average of 20 chromosomes is presented here. (A) Average of 20 chromosomes. (B) Average r2 for chromosome 1. The average correlation for markers 100 kb apart is r = 0.7, and for markers 1 Mb apart is r2 = 0.5 (C) Linkage disequilibrium blocks on distal chromosome 1. (D) Long-range LD patterns in the HMDP for these peak SNPs at 172.4 Mb, within coordinates of the Nos1ap gene, and 173.1, 30 kb upstream of the Apoa2 transcription start site on chromosome 1.

Similar articles

Cited by

References

    1. Aherrahrou Z, Doehring LC, Ehlers EM, Liptau H, Depping R, Linsel-Nitschke P, Kaczmarek PM, Erdmann J, Schunkert H. An alternative splice variant in Abcc6, the gene causing dystrophic calcification, leads to protein deficiency in C3H/He mice. J Biol Chem. 2008;283:7608–7615. - PubMed
    1. Altshuler D, Daly MJ, Lander ES. Genetic mapping in human disease. Science. 2008;322:881–888. - PMC - PubMed
    1. Beck JA, Lloyd S, Hafezparast M, Lennon-Pierce M, Eppig JT, Festing MF, Fisher EM. Genealogies of mouse inbred strains. Nat Genet. 2000;24:23–25. - PubMed
    1. Castellani LW, Nguyen CN, Charugundla S, Weinstein MM, Doan CX, Blaner WS, Wongsiriroj N, Lusis AJ. Apolipoprotein AII is a regulator of very low density lipoprotein metabolism and insulin resistance. J Biol Chem. 2008;283:11633–11644. - PMC - PubMed
    1. Cervino AC, Darvasi A, Fallahi M, Mader CC, Tsinoremas NF. An integrated in silico gene mapping strategy in inbred mice. Genetics. 2007;175:321–333. - PMC - PubMed

Publication types

Substances