In vivo visualization of photoreceptor layer and lipofuscin accumulation in stargardt's disease and fundus flavimaculatus by high resolution spectral-domain optical coherence tomography
- PMID: 20054419
- PMCID: PMC2801640
- DOI: 10.2147/opth.s7894
In vivo visualization of photoreceptor layer and lipofuscin accumulation in stargardt's disease and fundus flavimaculatus by high resolution spectral-domain optical coherence tomography
Abstract
Introduction: To assess photoreceptor (PR) layer morphology in patients with Stargardt's disease (STGD) and fundus flavimaculatus (FFM) using high resolution spectral domain optical coherence tomography (HD-OCT; OCT 4000 Cirrus, Humphrey-Zeiss, San Leandro, CA).
Methods: This was a prospective observational case series. Sixteen consecutive patients with STGD and FFM underwent a complete ophthalmologic examination. Optical coherence tomography examination was performed with HD-OCT, a high-speed (27,000 axial scans per second) OCT system using spectral/Fourier domain detection, with an axial image resolution of 5 mum.
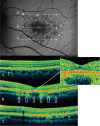
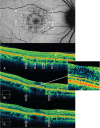
Results: A total of 31 eyes were included in the study. Transverse loss of the PR layer in the foveal region was shown by HD-OCT. Twenty eyes with clinically evident central atrophy had a disruption of either the Verhoeff's membrane (VM) or the layer corresponding to the interface of inner segment (IS) and outer segment (OS) of PR in the foveal region. Among these eyes, 12/20 eyes had a loss of the PR layer (loss of both VM and IS-OS interface) in the foveal region. Eleven eyes (11/31) without clinically evident central atrophy had an intact interface of IS and OS of PR centrally. Moreover, we observed hyperreflective deposits: type 1 lesions located within the retinal pigment epithelium (RPE) layer and at the level of the outer segments of PR, and type 2 lesions located at the level of the outer nuclear layer and clearly separated from the RPE layer. Type 1 lesions alone were associated with absence of loss of the PR layer in the foveal region in all eyes; type 2 lesions were always associated with presence of type 1 lesions, and often (8/12 eyes) associated with loss of the PR layer within the foveal region. Mean best-corrected visual acuity (BCVA) was significantly correlated with loss of the PR layer in the foveal region (P < 0.001), as well as to presence of type 2 flecks (P = 0.03).
Conclusion: Type 2 deposits in STGD/FFM patients seem to represent a marker of the possible evolution towards foveal atrophy.
Keywords: fundus flavimaculatus; high definition optical coherence tomography; retinal dystrophy; stargardt’s disease.
Figures


Similar articles
-
Assessment of central visual function in Stargardt's disease/fundus flavimaculatus with ultrahigh-resolution optical coherence tomography.Invest Ophthalmol Vis Sci. 2005 Jan;46(1):310-6. doi: 10.1167/iovs.04-0212. Invest Ophthalmol Vis Sci. 2005. PMID: 15623790
-
Correlation of visual function impairment and OCT findings in patients with Stargardt disease and fundus flavimaculatus.Eur J Ophthalmol. 2008 Mar-Apr;18(2):239-47. doi: 10.1177/112067210801800212. Eur J Ophthalmol. 2008. PMID: 18320517
-
Analysis of retinal flecks in fundus flavimaculatus using high-definition spectral-domain optical coherence tomography.Am J Ophthalmol. 2010 Sep;150(3):330-7. doi: 10.1016/j.ajo.2010.04.001. Epub 2010 Jun 25. Am J Ophthalmol. 2010. PMID: 20579629
-
Reticular pattern dystrophy of the retina: a spectral-domain optical coherence tomography analysis.Am J Ophthalmol. 2013 Dec;156(6):1228-37. doi: 10.1016/j.ajo.2013.07.020. Epub 2013 Sep 25. Am J Ophthalmol. 2013. PMID: 24075421
-
Hereditary retinal eye diseases in childhood and youth affecting the central retina.Oman J Ophthalmol. 2013 Sep;6(Suppl 1):S18-25. doi: 10.4103/0974-620X.122290. Oman J Ophthalmol. 2013. PMID: 24391367 Free PMC article. Review.
Cited by
-
Optical coherence tomography in pediatric patients: a clinical review.Ther Adv Ophthalmol. 2020 Feb 5;12:2515841420904612. doi: 10.1177/2515841420904612. eCollection 2020 Jan-Dec. Ther Adv Ophthalmol. 2020. PMID: 32076655 Free PMC article. Review.
-
Three-dimensional spectral domain optical coherence tomography in Stargardt disease and fundus flavimaculatus.J Ocul Biol Dis Infor. 2012 Dec 7;5(1):13-8. doi: 10.1007/s12177-012-9093-y. eCollection 2012. J Ocul Biol Dis Infor. 2012. PMID: 24319520 Free PMC article. No abstract available.
-
Functional Analysis of Retinal Flecks in Stargardt Disease.J Clin Exp Ophthalmol. 2012 Jul 30;3:10.4172/2155-9570.1000233. doi: 10.4172/2155-9570.1000233. J Clin Exp Ophthalmol. 2012. PMID: 24409374 Free PMC article.
-
The potential of spectral domain optical coherence tomography imaging based retinal biomarkers.Int J Retina Vitreous. 2017 Jan 9;3:1. doi: 10.1186/s40942-016-0054-7. eCollection 2017. Int J Retina Vitreous. 2017. PMID: 28078103 Free PMC article. Review.
References
-
- Stargardt K. Ueber familiare progressive degeneration in der makulagegend des Auges. Albrecht V Graefes Arch Ophthalmol. 1909;71:534–550.
-
- Cibis GW, Morey M, Karris DJ. Dominantly inherited macular dystrophy with flecks (Stargardt) Arch Ophthalmol. 1980;98:1785–1789. - PubMed
-
- Merlin S, Landau J. Abnormal findings in relatives of patients with juvenile hereditary macular degeneration (Stargardt’s disease) Ophthalmologica. 1970;161:1–10. - PubMed
-
- Franceschetti A, Francois J. Fundus flavimaculatus. Arch Ophthalmol. 1965;25:505. - PubMed
-
- Allikmets R, Singh N, Sun H, et al. A photoreceptor cell-specific ATP-binding transporter gene (ABCR) is mutated in recessive Stargardt macular dystrophy. Nat Genet. 1997;15:236–246. - PubMed
LinkOut - more resources
Full Text Sources
Research Materials

