

Immune response among patients exposed to molds
- PMID: 20054481
- PMCID: PMC2802005
- DOI: 10.3390/ijms10125471
Immune response among patients exposed to molds
Abstract
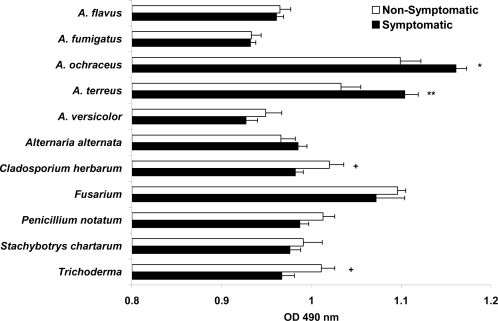
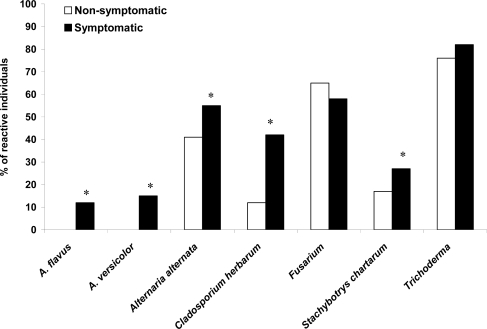
Macrocyclic trichothecenes, mycotoxins produced by Stachybotrys chartarum, have been implicated in adverse reactions in individuals exposed to mold-contaminated environments. Cellular and humoral immune responses and the presence of trichothecenes were evaluated in patients with mold-related health complaints. Patients underwent history, physical examination, skin prick/puncture tests with mold extracts, immunological evaluations and their sera were analyzed for trichothecenes. T-cell proliferation, macrocyclic trichothecenes, and mold specific IgG and IgA levels were not significantly different than controls; however 70% of the patients had positive skin tests to molds. Thus, IgE mediated or other non-immune mechanisms could be the cause of their symptoms.
Keywords: clinical symptoms; immune response; molds; mycotoxins.
Figures


Similar articles
-
Detection of trichothecene mycotoxins in sera from individuals exposed to Stachybotrys chartarum in indoor environments.Arch Environ Health. 2004 Jun;59(6):317-23. doi: 10.3200/aeoh.58.6.317-323. Arch Environ Health. 2004. PMID: 16238166
-
Antibodies to molds and satratoxin in individuals exposed in water-damaged buildings.Arch Environ Health. 2003 Jul;58(7):421-32. doi: 10.1080/00039896.2003.11879143. Arch Environ Health. 2003. PMID: 15143855 Clinical Trial.
-
Stachybotrys chartarum (chartarum = atra = alternans) and other problems caused by allergenic fungi.Allergy Asthma Proc. 2003 Jan-Feb;24(1):1-7. Allergy Asthma Proc. 2003. PMID: 12635571 Review.
-
Adverse human health effects associated with molds in the indoor environment.J Occup Environ Med. 2003 May;45(5):470-8. doi: 10.1097/00043764-200305000-00006. J Occup Environ Med. 2003. PMID: 12762072 Review.
-
Environmental mold and mycotoxin exposures elicit specific cytokine and chemokine responses.PLoS One. 2015 May 26;10(5):e0126926. doi: 10.1371/journal.pone.0126926. eCollection 2015. PLoS One. 2015. PMID: 26010737 Free PMC article.
Cited by
-
Pollution of mycological surfaces in hospital emergency departments correlates positively with blood NKT CD3(+) 16(+) 56(+) and negatively with CD4(+) cell levels of their staff.Cent Eur J Immunol. 2016;41(1):71-7. doi: 10.5114/ceji.2016.58818. Epub 2016 Mar 24. Cent Eur J Immunol. 2016. PMID: 27095925 Free PMC article.
-
Precision Medicine: The Role of the MSIDS Model in Defining, Diagnosing, and Treating Chronic Lyme Disease/Post Treatment Lyme Disease Syndrome and Other Chronic Illness: Part 2.Healthcare (Basel). 2018 Nov 5;6(4):129. doi: 10.3390/healthcare6040129. Healthcare (Basel). 2018. PMID: 30400667 Free PMC article.
-
An Evolutionary-Based Framework for Analyzing Mold and Dampness-Associated Symptoms in DMHS.Front Immunol. 2017 Jan 9;7:672. doi: 10.3389/fimmu.2016.00672. eCollection 2016. Front Immunol. 2017. PMID: 28119688 Free PMC article.
-
The Putative Role of Viruses, Bacteria, and Chronic Fungal Biotoxin Exposure in the Genesis of Intractable Fatigue Accompanied by Cognitive and Physical Disability.Mol Neurobiol. 2016 May;53(4):2550-71. doi: 10.1007/s12035-015-9262-7. Epub 2015 Jun 17. Mol Neurobiol. 2016. PMID: 26081141 Review.
-
The Myth of Mycotoxins and Mold Injury.Clin Rev Allergy Immunol. 2019 Dec;57(3):449-455. doi: 10.1007/s12016-019-08767-4. Clin Rev Allergy Immunol. 2019. PMID: 31608429 Review.
References
-
- Khalili B, Montanaro MT, Bardana EJ., Jr Inhalational mold toxicity: fact or fiction? A clinical review of 50 cases. Ann. Allergy Asthma Immunol. 2005;95:239–246. - PubMed
-
- Edmondson DA, Nordness ME, Zacharisen MC, Kurup VP, Fink JN. Allergy and “toxic mold syndrome”. Ann. Allergy Asthma Immunol. 2005;94:234–239. - PubMed
-
- Portnoy JM, Kennedy K, Barnes CS. Controversies regarding dampness and mold growth in homes. Allergy Asthma Proc. 2007;28:257–258. - PubMed
-
- Hope AP, Simon RA. Excess dampness and mold growth in homes: an evidence-based review of the aeroirritant effect and its potential causes. Allergy Asthma Proc. 2007;28:262–270. - PubMed
-
- Johanning E. Indoor moisture and mold-related health problems. Eur. Ann. Allergy Clin. Immunol. 2004;36:182–185. - PubMed
MeSH terms
Substances
LinkOut - more resources
Full Text Sources
Miscellaneous
