. 2010 Mar 31;28(3):523-34.
doi: 10.1002/stem.299.

Inhibition of aldehyde dehydrogenase expands hematopoietic stem cells with radioprotective capacity

Affiliations

Inhibition of aldehyde dehydrogenase expands hematopoietic stem cells with radioprotective capacity

Garrett G Muramoto et al. Stem Cells. .

Abstract

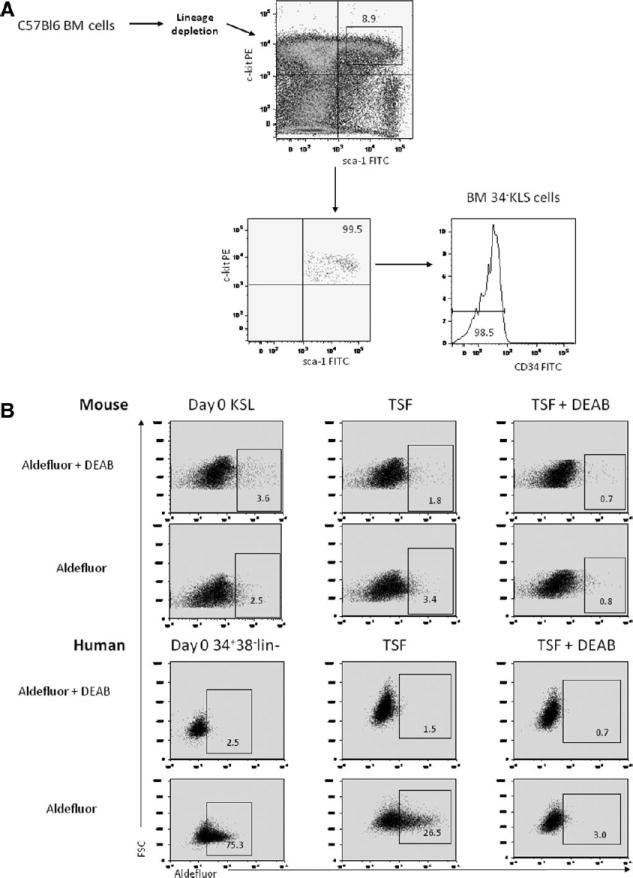
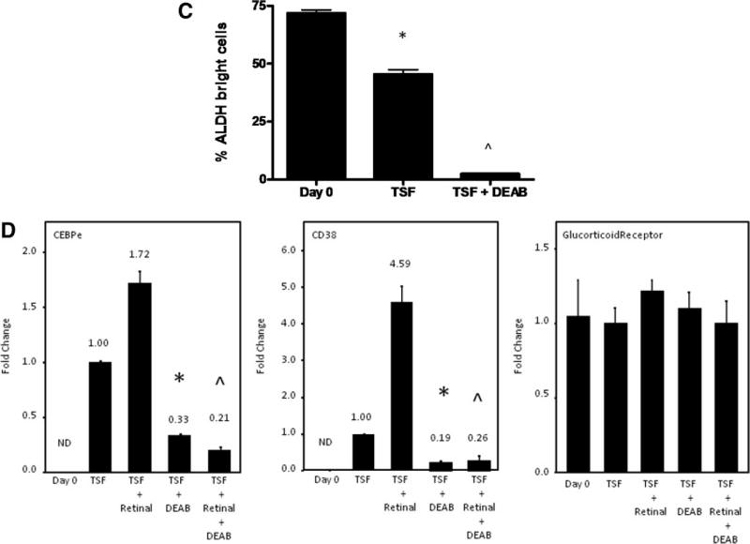
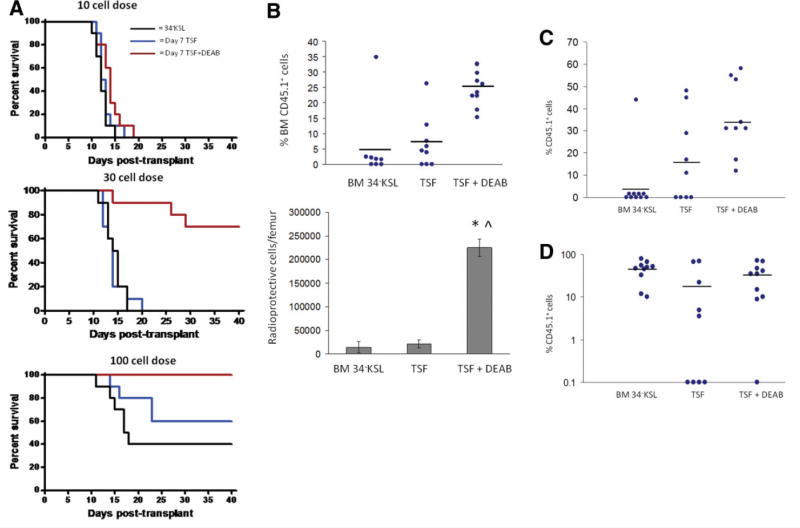
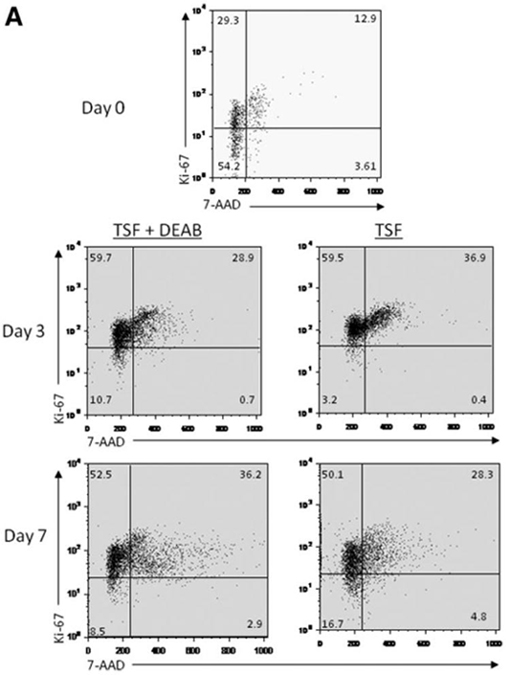
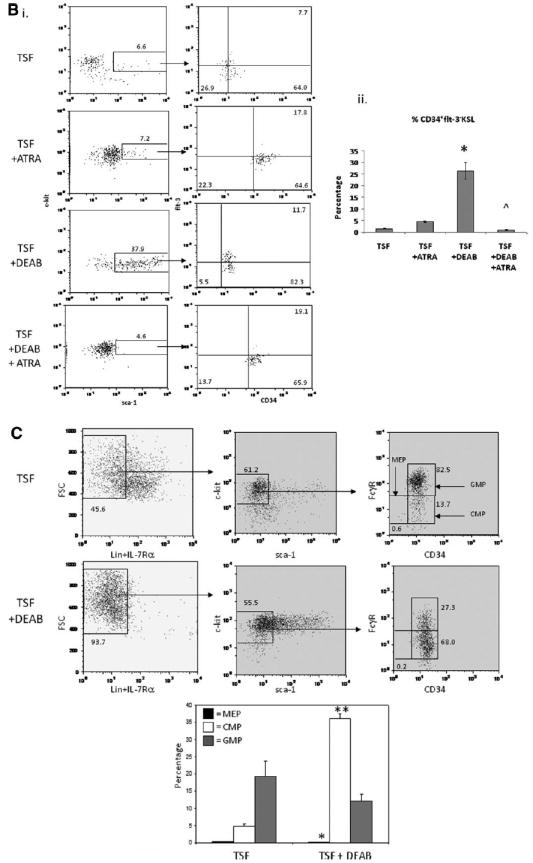
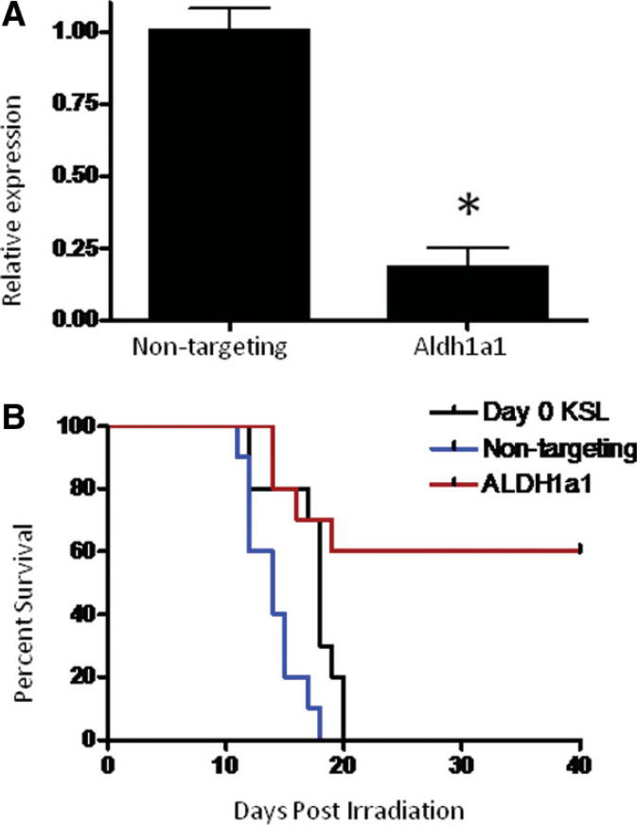
Hematopoietic stem cells (HSCs) are enriched for aldehyde dehydrogenase (ALDH) activity and ALDH is a selectable marker for human HSCs. However, the function of ALDH in HSC biology is not well understood. We sought to determine the function of ALDH in regulating HSC fate. Pharmacologic inhibition of ALDH with diethylaminobenzaldehyde (DEAB) impeded the differentiation of murine CD34(-)c-kit(+)Sca-1(+)lineage(-) (34(-)KSL) HSCs in culture and facilitated a ninefold expansion of cells capable of radioprotecting lethally irradiated mice compared to input 34(-)KSL cells. Treatment of bone marrow (BM) 34(-)KSL cells with DEAB caused a fourfold increase in 4-week competitive repopulating units, verifying the amplification of short-term HSCs (ST-HSCs) in response to ALDH inhibition. Targeted siRNA of ALDH1a1 in BM HSCs caused a comparable expansion of radioprotective progenitor cells in culture compared to DEAB treatment, confirming that ALDH1a1 was the target of DEAB inhibition. The addition of all trans retinoic acid blocked DEAB-mediated expansion of ST-HSCs in culture, suggesting that ALDH1a1 regulates HSC differentiation via augmentation of retinoid signaling. Pharmacologic inhibition of ALDH has therapeutic potential as a means to amplify ST-HSCs for transplantation purposes.


Figures

Figure 1
Figure 1
DEAB inhibits ALDH enzyme activity and blocks retinoid signaling in HSCs. (A): FACS-based strategy for isolation of BM CD34-KSL cells is shown. Whole BM cells from adult C57Bl6 mice were lineage-depleted and subsequently stained with antibodies to c-kit, Sca-1, and CD34 and the CD34-KSL population was collected by FACS. (B): Representative flow cytometric analysis using the Aldefluor reagent was performed on murine BM KSL cells at day 0 and after 7 days of culture with TSF versus TSF + DEAB (top). Identical analysis was performed on human CB CD34+CD38-lin− cells under the same conditions (bottom). (C): Treatment of BM 34-KSL cells with TSF + DEAB caused a significant reduction in ALDH-positive cells in culture (means ± SD, n = 3; *, p = .02 vs. day 0;∧, p = .01 vs. day 0, p = .02 vs. TSF). (D): The expression of CEPBε and CD38, RAR-dependent genes, is shown in murine BM 34-KSL cells at day 0 and after culture with TSF, TSF + DEAB, TSF + retinal, and TSF + retinal + DEAB. Treatment with DEAB blocked cytokine-induced (TSF, SCF, Flt-3 ligand) and retinal-induced expression of CEBPε (*, p < .001; ∧, p < .001) and CD38 (*, p < .001; ∧, p < .001) in BM HSCs. Neither retinal nor DEAB affected the expression of the glucocorticoid receptor, a non-RAR-dependent gene (n = 3, means ± SD). Numbers represent the fold change relative to expression in the TSF group. Abbreviations: 34-KSL, CD34−c-kit+Sca-1+lineage−; ALDH, aldehyde dehydrogenase; BM, bone marrow; CB, cord blood; DEAB, diethylaminobenzaldehyde; Flt-3, fms-like tyrosine kinase-3; HSCs, hematopoietic stem cells; ND, not detected; RAR, retinoic acid receptor; SCF, stem cell factor; TSF, thrombopoietin, stem cell factor, Flt-3 ligand.
Figure 1
Figure 1
DEAB inhibits ALDH enzyme activity and blocks retinoid signaling in HSCs. (A): FACS-based strategy for isolation of BM CD34-KSL cells is shown. Whole BM cells from adult C57Bl6 mice were lineage-depleted and subsequently stained with antibodies to c-kit, Sca-1, and CD34 and the CD34-KSL population was collected by FACS. (B): Representative flow cytometric analysis using the Aldefluor reagent was performed on murine BM KSL cells at day 0 and after 7 days of culture with TSF versus TSF + DEAB (top). Identical analysis was performed on human CB CD34+CD38-lin− cells under the same conditions (bottom). (C): Treatment of BM 34-KSL cells with TSF + DEAB caused a significant reduction in ALDH-positive cells in culture (means ± SD, n = 3; *, p = .02 vs. day 0;∧, p = .01 vs. day 0, p = .02 vs. TSF). (D): The expression of CEPBε and CD38, RAR-dependent genes, is shown in murine BM 34-KSL cells at day 0 and after culture with TSF, TSF + DEAB, TSF + retinal, and TSF + retinal + DEAB. Treatment with DEAB blocked cytokine-induced (TSF, SCF, Flt-3 ligand) and retinal-induced expression of CEBPε (*, p < .001; ∧, p < .001) and CD38 (*, p < .001; ∧, p < .001) in BM HSCs. Neither retinal nor DEAB affected the expression of the glucocorticoid receptor, a non-RAR-dependent gene (n = 3, means ± SD). Numbers represent the fold change relative to expression in the TSF group. Abbreviations: 34-KSL, CD34−c-kit+Sca-1+lineage−; ALDH, aldehyde dehydrogenase; BM, bone marrow; CB, cord blood; DEAB, diethylaminobenzaldehyde; Flt-3, fms-like tyrosine kinase-3; HSCs, hematopoietic stem cells; ND, not detected; RAR, retinoic acid receptor; SCF, stem cell factor; TSF, thrombopoietin, stem cell factor, Flt-3 ligand.
Figure 2
Figure 2
Inhibition of ALDH increases the frequency of phenotypic and functional BM progenitor cells in culture. (A): Representative flow cytometric analyses are shown of day 0 BM 34-KSL cells (top) and the progeny of 34-KSL cells after 7-day culture with TSF alone (left) and TSF + DEAB (right). Note that the progeny of TSF + DEAB remain lineage negative at day +7, with increased KSL content compared to the progeny of TSF alone. (B): The addition of DEAB to cultures of 34-KSL cells caused a significant reduction in total cell expansion compared to TSF alone (upper left, *, p = .001), but yielded a significant increase in the percentage of lineage negative progenitor cells (upper right, *, p < .001) and percentage of KSL cells compared to treatment with TSF alone (lower left, *, p = .01) (n = 3–5, means ± SD). The absolute number of KSL cells was 2.6-fold increased in TSF cultures compared to TSF + DEAB (lower right, *, p = .001) (n = 3–5, means ± SD). (C): Inhibition of ALDH preserves CFC content in cultures of BM 34-KSL cells. CFC assays were performed using day 0 BM 34-KSL cells or their progeny after 7-day culture with TSF alone or TSF + DEAB. The mean number of CFU total was 16-fold increased in the TSF + DEAB cultures compared to TSF alone. *, p = .009 for difference between CFCs in TSF + DEAB versus TSF alone (n = 3, means ± SD). Gray bar indicates CFU-GM, black bar indicates BFU-E, and white bar indicates CFU-Mix. Abbreviations: ALDH, aldehyde dehydrogenase; BFU-E, burst forming unit-erythroid; BM, bone marrow; 34-KSL, CD34−c-kit+Sca-1+lineage−; CFC, colony forming cell; CFU, colony-forming unit; CFU-GM, colony forming unit-granulocyte monocyte; CFU-Mix, colony forming unit-mix; DEAB, diethylaminobenzaldehyde; TSF, thrombopoietin.
Figure 3
Figure 3
Inhibition of ALDH expands ST-HSCs with radioprotective capacity. (A): Kaplan-Meier analysis of the survival of lethally irradiated (950-cGy total body irradiation (TBI)) adult C57BL6 mice transplanted with 10, 30, or 100 BM 34-KSL cells from B6.SJL donors (black line) or the progeny of the same dose of BM 34-KSL cells after 7-day culture with TSF alone (blue line) or TSF + DEAB (red line) is shown (30-cell dose: p < .0001 and p < .0001 for TSF + DEAB group vs. day 0 and TSF groups; 100-cell dose: p = .004, p = .03 for TSF + DEAB vs. day 0 and TSF groups; n = 10 mice per dose per condition). (B): (Top) Lethally irradiated mice transplanted with the progeny of BM 34-KSL cells cultured with TSF + DEAB have higher levels of donor CD45.1+ cell engraftment (blue dots) in the BM at day +14 than mice transplanted with day 0 BM 34-KSL cells or their progeny after culture with TSF alone (mean 25.0% ± 1.9 donor CD45.1+ cells vs. 5.4% ± 4.9% vs. 6.8% ± 1.7% at day +14; p = .0008 and p < .0001 vs. day 0 and TSF group; n = 10 mice per condition; horizontal bars represent mean engraftment). (Bottom) Mice transplanted with the progeny of BM 34-KSL cells treated with TSF + DEAB have significantly increased numbers of donor CD45.1+ radioprotective cells per femur (% CD45.1+ cells × total BM cells) at day +14 compared to mice transplanted with day 0 BM 34-KSL cells or the progeny of TSF cultures (mean 224,862 CD45.1+ cells per femur vs. 14,562 cells per femur vs. 21,577 cells per femur; *, p < .0001 vs. day 0; ∧, p < .0001 vs. TSF group; means ± SD, n = 8–10 per group). (C): Inhibition of ALDH causes an expansion of short-term CRU. A scatter plot is shown of engraftment of donor CD45.1+ cells (blue dots) at 4 weeks in the PB of lethally irradiated CD45.2+ recipient mice after competitive repopulating assay (100-cell dose) with day 0 BM 34-KSL cells or their progeny after 7-day culture with TSF or TSF + DEAB. Horizontal bars represent mean levels of engraftment. (D): Inhibition of ALDH does not facilitate the expansion of LT-HSCs. A representative scatter plot is shown demonstrating peripheral blood (PB) donor CD45.1+ cell engraftment at 12 weeks in lethally irradiated CD45.2+ mice after transplantation of 100 donor BM34-KSL cells or their progeny after 7-day culture with TSF or TSF + DEAB. Horizontal bars represent mean levels of engraftment. Abbreviations: ALDH, aldehyde dehydrogenase; BM, bone marrow; 34-KSL, CD34−c-kit+Sca-1+lineage−; CRU, competitive repopulating assay; DEAB, diethylaminobenzaldehyde; HSCs, hematopoietic stem cells; LT-HSCs, hematopoietic stem cells; ST-HSCs, short-term hematopoietic stem cells; TSF, thrombopoietin.
Figure 4
Figure 4
Antagonism of ALDH inhibits cell cycle progression of HSCs and increases the frequency of 34+Flt-3-KSL cells in culture compared to cytokines alone. (A): A representative cell cycle analysis of 34-KSL cells and their progeny after 7-day cultures with TSF alone or TSF + DEAB is shown. The majority (mean 83.5%) of day 0 34-KSL cells were in G0/G1. At day +3, the progeny of TSF + DEAB cultures demonstrated a modest increase in cells in G0 and decreased numbers in G2/S/M phase, consistent with overall inhibition of cell cycle progression compared to TSF alone. At day +7, the progeny of TSF cultures demonstrated increased numbers of cells in G0 compared to TSF + DEAB. (B): (i) Representative FACS analyses of 34+Flt-3-KSL cells in culture of BM 34-KSL cells with TSF, TSF + 1 μM ATRA, TSF + DEAB, or TSF + DEAB + ATRA are shown. (ii) Treatment with TSF + DEAB supported an increase in the frequency of 34+Flt-3-KSL cells in culture compared to culture with TSF alone (*, p = .003, n = 3, mean ± SD). The addition of ATRA reversed the effects of DEAB on ST-HSC expansion in culture (∧p = .003, n = 3; mean ± SD). (C): Representative FACS analyses of CMP and MEP content are shown for BM 34-KSL cells after culture with TSF (top) or TSF + DEAB (middle). The progeny of TSF + DEAB cultures contained an increased frequency of CMPs compared to the progeny of TSF alone (mean 36.1% vs. 4.8%, **, p < .001) and a decreased frequency of MEPs (mean 0.1% vs. 0.3%, respectively; *, p = .01) (n = 6; means ± SD) (bottom). Abbreviations: ALDH, aldehyde dehydrogenase; ATRA, All trans retinoic acid; 34-KSL, CD34−c-kit+Sca-1+lineage−; CMP, common myeloid progenitor; DEAB, diethylaminobenzaldehyde; Flt-3, fms-like tyrosine kinase-3; HSCs, hematopoietic stem cells; MEP, megakaryocyte-erythroid progenitor; TSF, thrombopoietin.
Figure 4
Figure 4
Antagonism of ALDH inhibits cell cycle progression of HSCs and increases the frequency of 34+Flt-3-KSL cells in culture compared to cytokines alone. (A): A representative cell cycle analysis of 34-KSL cells and their progeny after 7-day cultures with TSF alone or TSF + DEAB is shown. The majority (mean 83.5%) of day 0 34-KSL cells were in G0/G1. At day +3, the progeny of TSF + DEAB cultures demonstrated a modest increase in cells in G0 and decreased numbers in G2/S/M phase, consistent with overall inhibition of cell cycle progression compared to TSF alone. At day +7, the progeny of TSF cultures demonstrated increased numbers of cells in G0 compared to TSF + DEAB. (B): (i) Representative FACS analyses of 34+Flt-3-KSL cells in culture of BM 34-KSL cells with TSF, TSF + 1 μM ATRA, TSF + DEAB, or TSF + DEAB + ATRA are shown. (ii) Treatment with TSF + DEAB supported an increase in the frequency of 34+Flt-3-KSL cells in culture compared to culture with TSF alone (*, p = .003, n = 3, mean ± SD). The addition of ATRA reversed the effects of DEAB on ST-HSC expansion in culture (∧p = .003, n = 3; mean ± SD). (C): Representative FACS analyses of CMP and MEP content are shown for BM 34-KSL cells after culture with TSF (top) or TSF + DEAB (middle). The progeny of TSF + DEAB cultures contained an increased frequency of CMPs compared to the progeny of TSF alone (mean 36.1% vs. 4.8%, **, p < .001) and a decreased frequency of MEPs (mean 0.1% vs. 0.3%, respectively; *, p = .01) (n = 6; means ± SD) (bottom). Abbreviations: ALDH, aldehyde dehydrogenase; ATRA, All trans retinoic acid; 34-KSL, CD34−c-kit+Sca-1+lineage−; CMP, common myeloid progenitor; DEAB, diethylaminobenzaldehyde; Flt-3, fms-like tyrosine kinase-3; HSCs, hematopoietic stem cells; MEP, megakaryocyte-erythroid progenitor; TSF, thrombopoietin.
Figure 5
Figure 5
siRNA-mediated knockdown of ALDH1a1 increases BM radioprotective cell capacity. (A): Quantitative reverse transcriptase- polymerase chain reaction (RT-PCR) analysis of ALDH1a1 expression in BM KSL cells treated with either nontargeting or ALDH1a1-specific siRNA constructs. ALDH1a1 expression was reduced by approximately 80% (*, p = .006) at day 7 as compared to nontargeting control (n = 3, means ± SD). (B): Kaplan-Meier analysis of survival of lethally irradiated (950 cGy) adult C57BL6 mice transplanted with 500 day 0 BM KSL cells (black line) or their progeny after 7-day culture with TSF, and either nontargeting (blue line) or ALDH1a1-specific siRNA (red line) (p = .02 and p = .007 for TSF + DEAB vs. day 0 and TSF groups, respectively; n = 10 mice per group). Abbreviations: ALDH, aldehyde dehydrogenase; BM, bone marrow; 34-KSL, CD34−c-kit+Sca-1+lineage−; DEAB, diethylaminobenzaldehyde; HSCs, hematopoietic stem cells; TSF, thrombopoietin, stem cell factor, Flt-3 ligand.

Similar articles

Cited by

References

    1. Laughlin MJ, Eapen M, Rubinstein P, et al. Outcomes after transplantation of cord blood or bone marrow from unrelated donors in adults with leukemia. N Engl J Med. 2004;351:2265–2275. - PubMed
    1. Cornelissen JJ, Lowenberg B. Role of allogeneic stem cell transplantation in current treatment of acute myeloid leukemia. Hematology Am Soc Hematol Educ Program. 2005:151–155. - PubMed
    1. Alyea EP, Kim HT, Ho V, et al. Impact of conditioning regimen intensity on outcome of allogeneic hematopoietic cell transplantation for advanced acute myelogenous leukemia and myelodysplastic syndrome. Biol Blood Marrow Transplant. 2006;12:1047–1055. - PubMed
    1. Meijer E, Dekker AW, Lokhorst HM, et al. Low incidence of infectious complications after nonmyeloablative compared with myeloablative allogeneic stem cell transplantation. Transpl Infect Dis. 2004;6:171–178. - PubMed
    1. Barker JN. Umbilical Cord Blood (UCB) Transplantation: An Alternative to the Use of Unrelated Volunteer Donors? Hematology Am Soc Hematol Educ Program. 2007:55–61. - PubMed

Publication types

MeSH terms