Comparative Study
. 2010 Feb;51(2):642-53.
doi: 10.1002/hep.23357.

Integrated approach for the identification of human hepatocyte nuclear factor 4alpha target genes using protein binding microarrays

Affiliations
Comparative Study

Integrated approach for the identification of human hepatocyte nuclear factor 4alpha target genes using protein binding microarrays

Eugene Bolotin et al. Hepatology. 2010 Feb.

Abstract

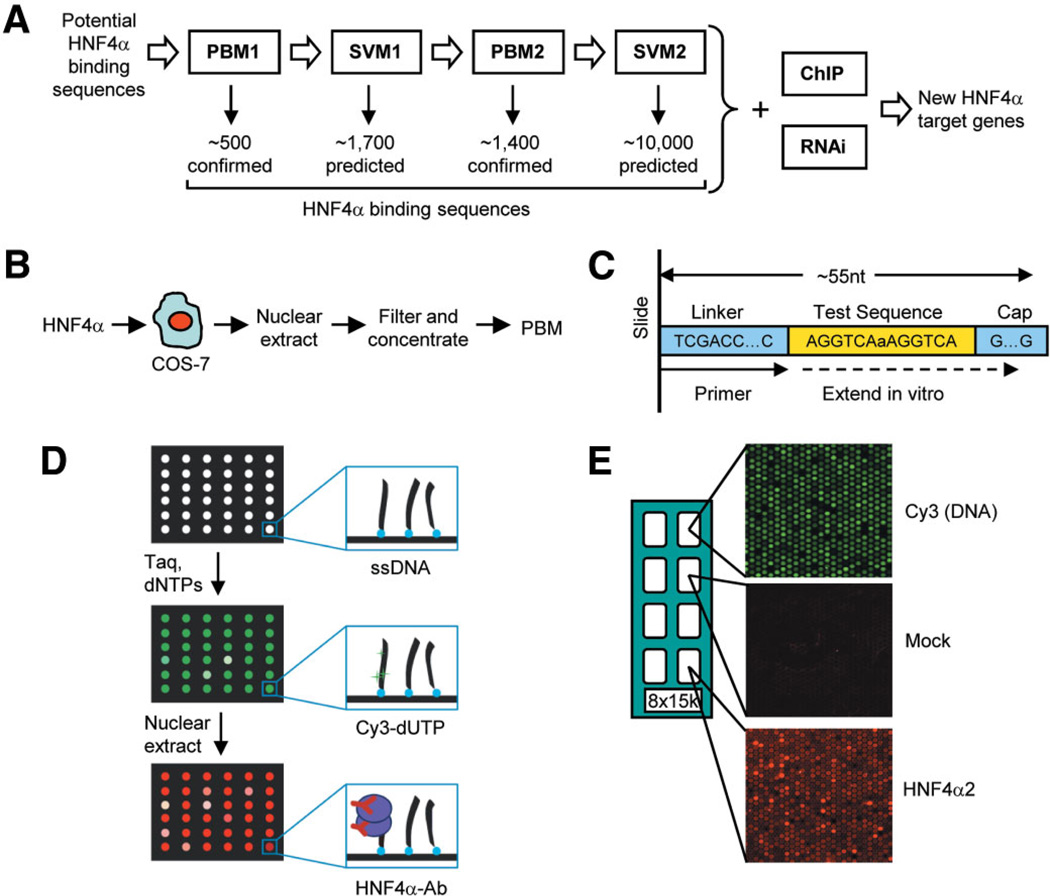
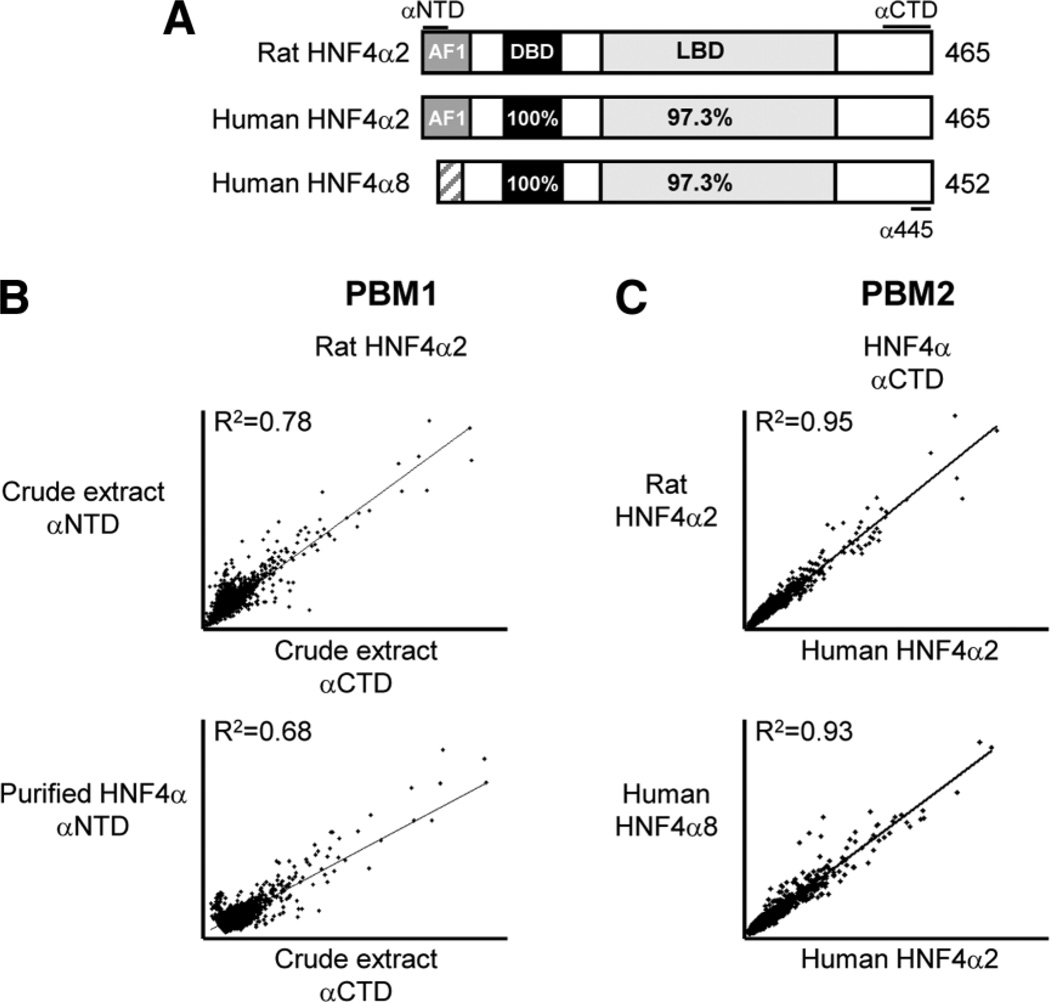
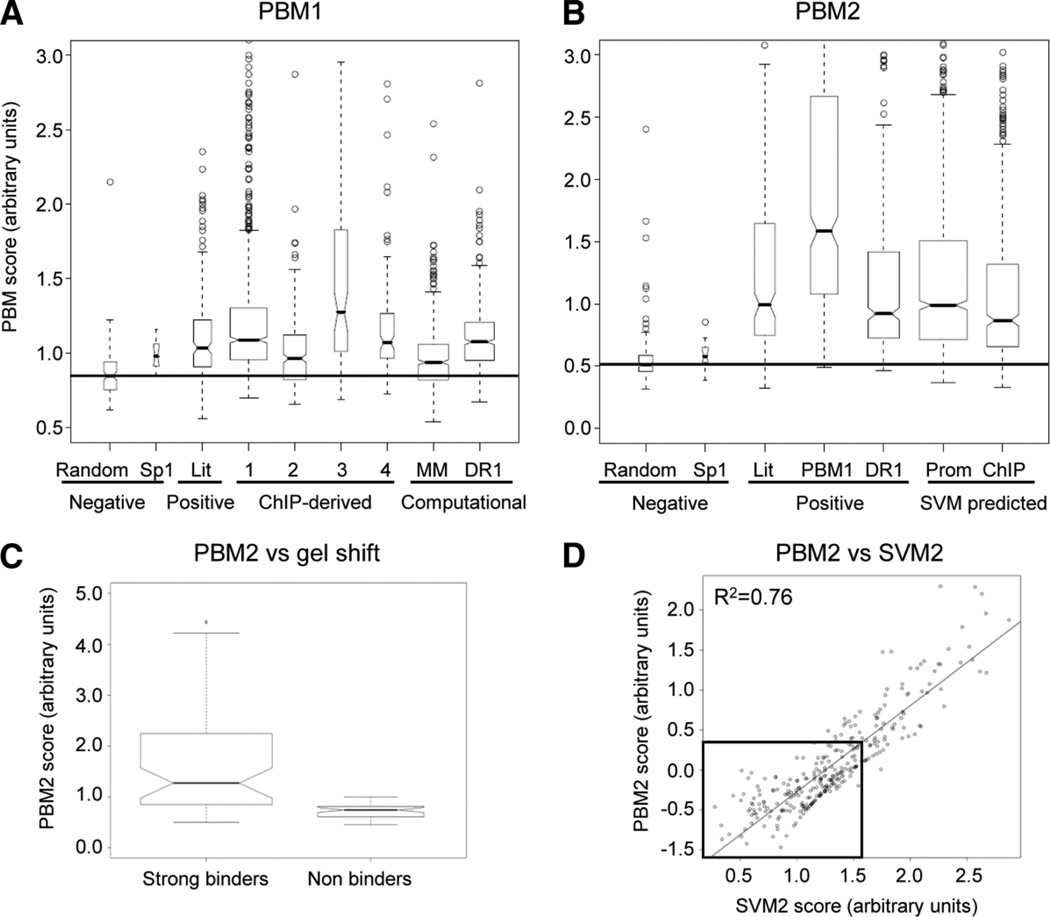
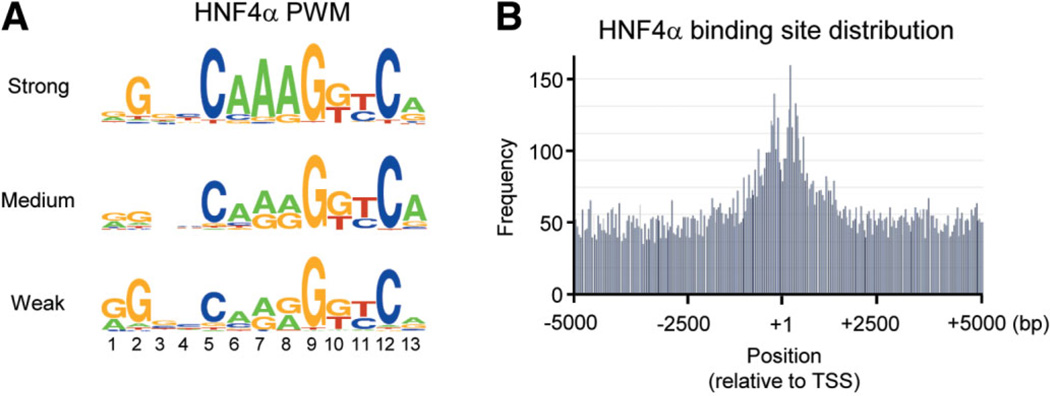
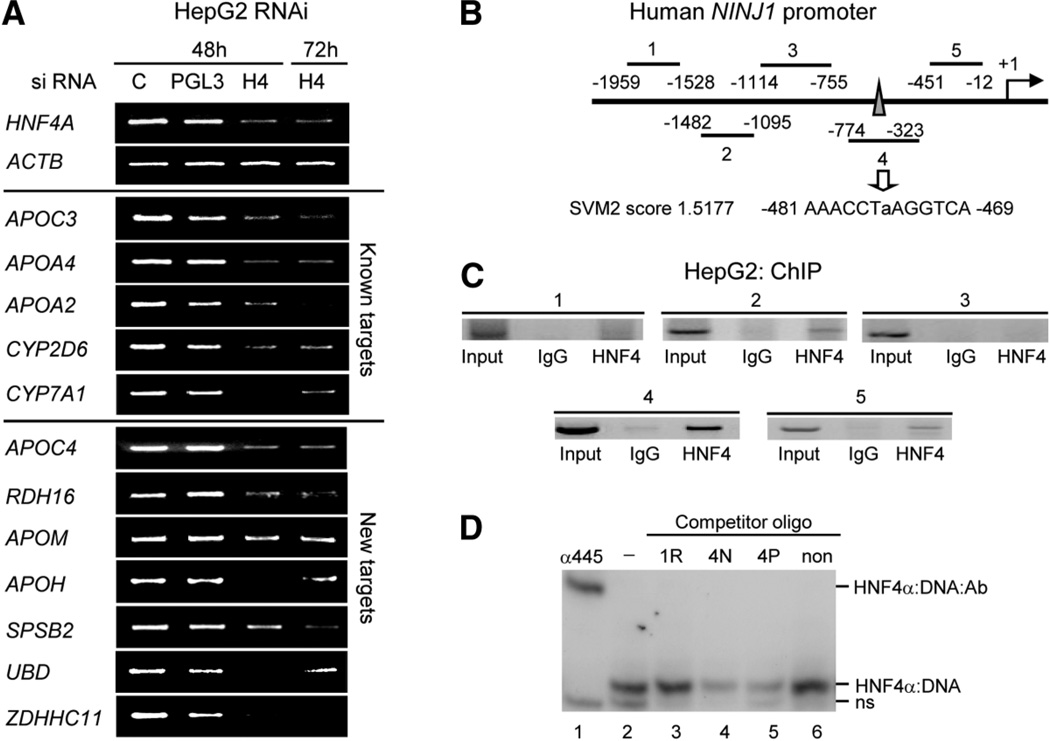
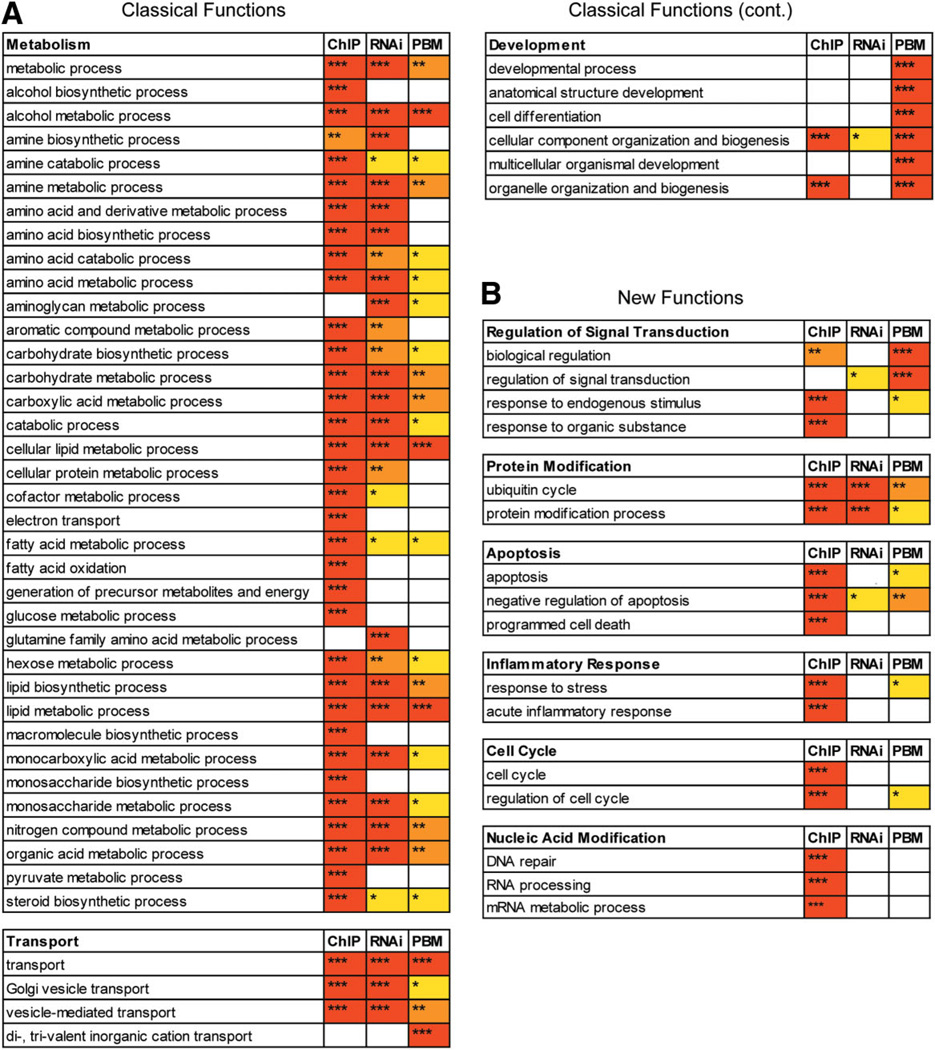
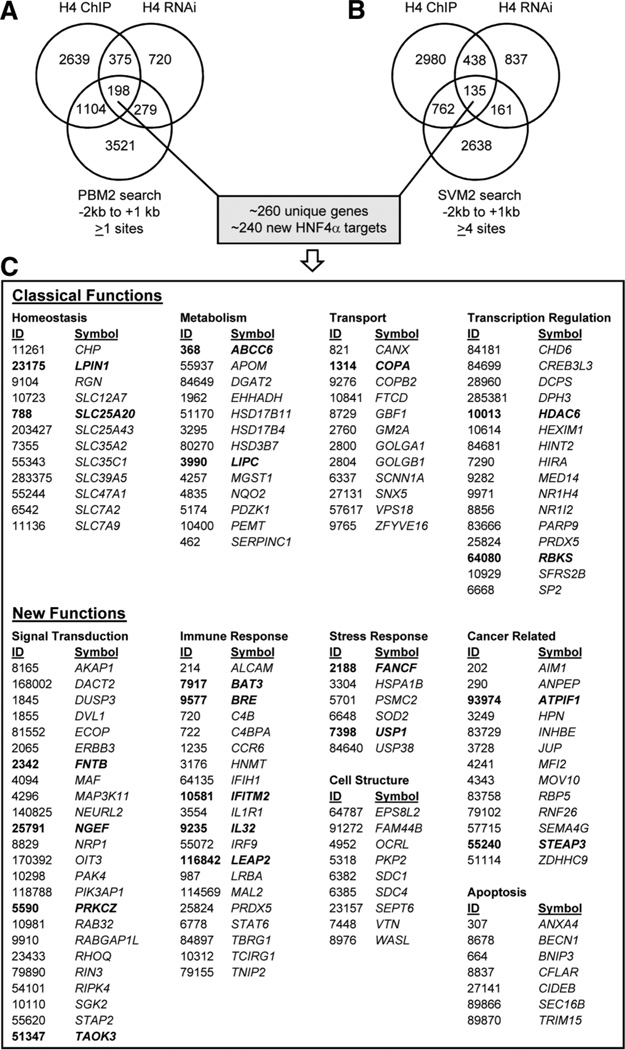
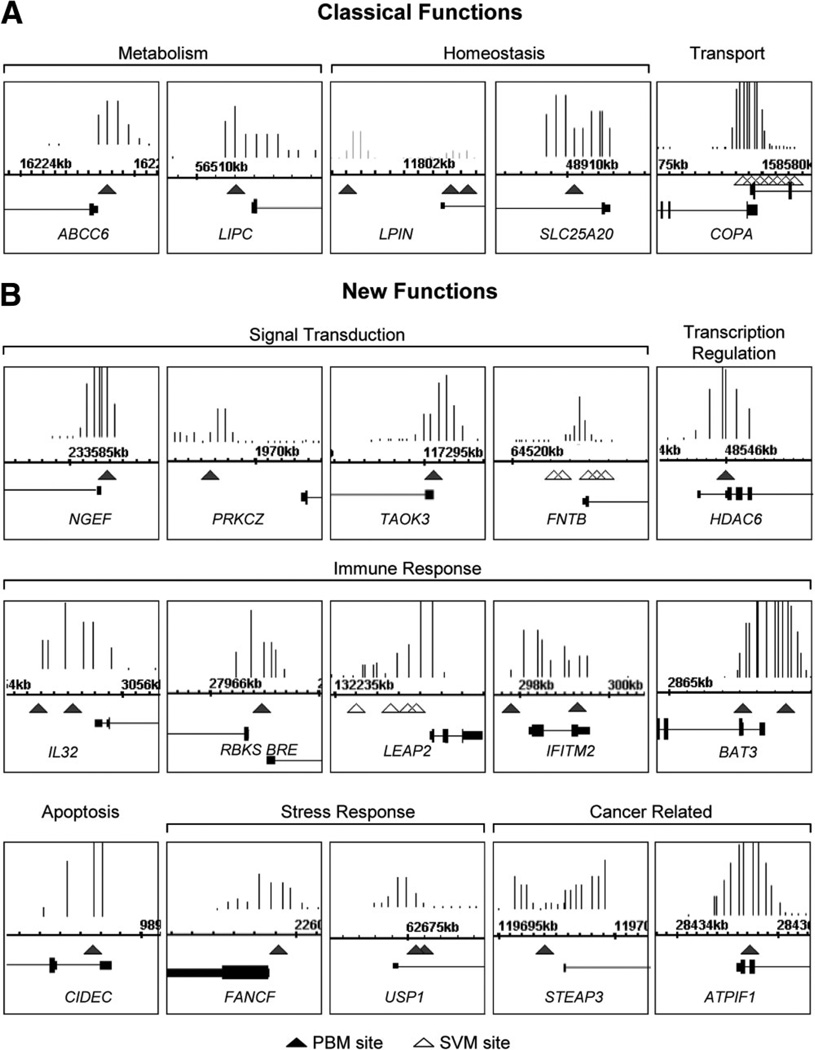
Hepatocyte nuclear factor 4 alpha (HNF4alpha), a member of the nuclear receptor superfamily, is essential for liver function and is linked to several diseases including diabetes, hemophilia, atherosclerosis, and hepatitis. Although many DNA response elements and target genes have been identified for HNF4alpha, the complete repertoire of binding sites and target genes in the human genome is unknown. Here, we adapt protein binding microarrays (PBMs) to examine the DNA-binding characteristics of two HNF4alpha species (rat and human) and isoforms (HNF4alpha2 and HNF4alpha8) in a high-throughput fashion. We identified approximately 1400 new binding sequences and used this dataset to successfully train a Support Vector Machine (SVM) model that predicts an additional approximately 10,000 unique HNF4alpha-binding sequences; we also identify new rules for HNF4alpha DNA binding. We performed expression profiling of an HNF4alpha RNA interference knockdown in HepG2 cells and compared the results to a search of the promoters of all human genes with the PBM and SVM models, as well as published genome-wide location analysis. Using this integrated approach, we identified approximately 240 new direct HNF4alpha human target genes, including new functional categories of genes not typically associated with HNF4alpha, such as cell cycle, immune function, apoptosis, stress response, and other cancer-related genes.

Conclusion: We report the first use of PBMs with a full-length liver-enriched transcription factor and greatly expand the repertoire of HNF4alpha-binding sequences and target genes, thereby identifying new functions for HNF4alpha. We also establish a web-based tool, HNF4 Motif Finder, that can be used to identify potential HNF4alpha-binding sites in any sequence.


Conflict of interest statement

Potential conflict of interest: Nothing to report.

Figures

Fig. 1
Fig. 1
Integrated approach for the identification of direct target genes and protein binding microarray (PBM) design. (A) Overview of workflow. Known and predicted HNF4α-binding sequences (217 sequences from the literature, sites predicted by the Markov model and ChIP-chip analysis, and random controls) were printed on the first-generation PBM (PBM1) and incubated with minimally processed crude nuclear extracts from COS-7 cells transfected with full-length HNF4α (B). Results from the initial screen were used to train the Support Vector Machine (SVM1), resulting in 1700 predicted HNF4α-binding sequences that were printed onto a second-generation PBM (PBM2). Searches of human promoters using PBM/SVM results were cross-referenced with results from RNAi expression profiling and ChIP-chip to identify new HNF4α targets. (C, D) Overview of PBM. Single-stranded oligonucleotides with a common linker, test sequence, and a G/C-rich cap region (C) printed on the PBM were extended in vitro in the presence of Cy3-dUTP (D). The PBMs were incubated with extracts containing HNF4α and visualized by immunofluorescence. (E) Typical PBM results are shown. Double-stranded DNA with Cy3 incorporated (top panel), mock-transfected cells lacking HNF4α (middle panel), and extracts containing HNF4α with fluorescent signal proportional to the binding affinity (bottom panel). An array of 8 × 15k, Agilent microarray slide with eight replicate subarrays with ~3000 unique sequences each spotted five times (~15,000 spots) per subarray. Supporting Fig. 1 shows that nontransfected COS-7 cells do not express HNF4α and that the antibody used to detect HNF4α in the PBM is completely specific. Supporting Fig. 2 shows a linear relationship between Cy3 incorporation and the number of A’s in the extended sequence.
Fig. 2
Fig. 2
Reproducibility of the PBM. (A) Diagram of HNF4α splice variants used in PBM indicating percent amino acid identity in conserved regions. AF1, activation function 1; DBD, DNA-binding domain; LBD, ligand-binding domain. The regions of the protein detected by the monoclonal antibodies (αNTD, amino-terminal HNF4α antibody; αCTD, carboxy-terminal HNF4α antibody) and the affinity-purified polyclonal antibody α445 are indicated. (See Supporting Materials and Methods for additional details on plasmids and antibodies.) (B) Scatter plot of individual spot intensities showing correlation between PBM1 using rat HNF4α2 protein and the αNTD and αCTD antibodies (top panel) as well as purified HNF4α2 versus crude nuclear extracts (bottom panel). (C) Scatter plot of PBM2 results as in (B) comparing different HNF4α isoforms from different species. See Supporting Figs. 3 and 4 for scatter plot matrices of PBM1 and PBM2 from nine experiments.
Fig. 3
Fig. 3
Relative binding affinities of HNF4α-binding sites. (A) Box plot of sequence categories represented on PBM1 and corresponding PBM score averaged from six independent arrays with each sequence spotted five times. Box width indicates the relative number of sequences per category. Nonoverlapping box plot notches strongly indicate that the medians significantly differ (P < 0.05). Boxes and whiskers (dashed line) represent quartiles of binding scores for each sequence category. Line, median of random sequences. Negative controls = randomly generated 13-mers; known Sp1 sites derived from the literature. Positive controls = 217 known HNF4α-binding sites from the literature (Lit) (Supporting Tables 1A and 1B). ChIP-derived, binding sites derived from published HNF4α ChIP-chip data: 1, from Odom et al.; 2, from Rada-Iglesias et al.; 3, our analysis of Odom et al. data using Bioprospector software; 4, our analysis of Odom et al. data using AlignACE software. Computational, binding sequences derived from our permutated Markov model (MM) and permutations of the DR1 consensus sequence (DR1). (B) Box plot of sequence categories represented in PBM2 (three independent arrays) as in (A). PBM1, best 500 sequences from PBM1; SVM predicted, sequences from SVM1 search of promoter regions of all annotated human genes (Prom) and ChIP-chip data (ChIP). For a complete list of all the sequences on PBM1 and PBM2 and binding scores, see Supporting Tables 2A and 2B. (C) Box plot of PBM2 results versus results from ~100 gel shift experiments showing a statistically significant difference (Student t test, P < 0.00622) between strong binders and nonbinders or very weak binders (see Supporting Materials and Methods and Supporting Fig. 6 for results). (D) Scatter plot of log(PBM2) intensity compared to SVM2 score of one of the 10-fold cross validation results used to evaluate the predictive power of SVM2. A cutoff of an SVM2 score >1.51, corresponding to three standard deviations from the mean of random controls, was used to identify binding sequences in subsequent analyses.
Fig. 4
Fig. 4
Position weight matrix (PWM) for HNF4α-binding sequence motif and HNF4α-binding site distribution. (A) PWM of HNF4α-binding sequences derived from PBM2. All sequences with relative binding affinity at least 2 standard deviations above the mean of the random controls were divided into three groups of ~450 each—strong, medium and weak—and used to generate the PWMs. (B) Distribution of potential HNF4α-binding sites around the transcription start site (TSS, +1) of all human promoters (UCSC hg18) as determined by an exact match search with PBM2 results. Sites are overrepresented in the −1 kb to +1 kb region. (See Supporting Fig. 7 for PWM and gel shifts of noncanonical binding sites detected in the PBM.)
Fig. 5
Fig. 5
HNF4α knockdown in HepG2 cells using RNAi and identification of Ninjurin 1 as a direct target of HNF4α. (A) Verification of HNF4α1/2 knockdown. HepG2 cells treated with siRNA for the hours indicated. Reverse transcription PCR was performed on the indicated HNF4α targets. C, no siRNA. PGL3, control siRNA. H4, HNF4α siRNA (all splice variants from the P1 promoter are targeted). (B) Human NINJ1 promoter showing regions amplified by PCR in ChIP in (C). Region 4 contains a predicted HNF4α-binding site with an SVM2 score of ~1.5177 (moderate binding affinity). (C) ChIP result of HNF4α in HepG2 cells on the human NINJ1 promoter using PCR primers that amplify regions 1–4 noted in (B). IgG, normal rabbit immunoglobulin G; HNF4, α445 antibody. (D) Gel shift assay using nuclear extracts from COS-7 cells transfected with rat HNF4α2, radiolabeled probe from the ApoA1 promoter and unlabeled competitors in 250-fold molar excess corresponding to the SVM site identified in region 4 with native flanking sequences (4N) or PBM flanking sequences (4P) as well as a known nonbinder (non, 175 TTR) and a randomly chosen sequence from region 1 (1R). Shown are the HNF4α:DNA shift complex, a supershift complex with the α445 antibody (HNF4α:DNA:antibody) and nonspecific band from the COS-7 extracts (ns); free probe is not shown. See Supporting Materials and Methods for details on gel shift conditions, Supporting Fig. 5 for immunoblot of HNF4α protein in the RNAi, Supporting Table 3A for a complete list of genes that are down-regulated, Supporting Table 3B for primer sequences, and Supporting Table 8 for gel shift sequences.
Fig. 6
Fig. 6
Comparative Gene Ontology for genes bound in vivo by HNF4α (ChIP-chip), down-regulated in HNF4α RNAi, and containing PBM or SVM HNF4α binding sites. Overrepresented categories from Gene Ontology analysis using DAVID of HNF4α ChIP-chip from primary human hepatocytes (ChIP), expression profiling of HNF4α knocked down in HepG2 cells using RNAi (RNAi) and PBM2 search of −2 kb to +1 kb of all annotated human genes (UCSC hg18) (PBM). Shown are the biological processes for which at least one of the three methods had a P value (EASE-score) of < 0.001 (***), < 0.01 (**), or < 0.05 (*). Redundant categories were removed. (A) Biological processes related to classical HNF4α target genes well-established in the literature (e.g., Supporting Table 1A). (B) Biological processes not typically associated with HNF4α. See Supporting Table 5 for a complete list of GO terms and P values for the ChIP, PBM, and RNAi as well as the SVM search (≥4 sites in −2 kb to +1 kb).
Fig. 7
Fig. 7
Cross-reference of three methods used to identify potential human HNF4α target genes: ChIP-chip, RNAi expression profiling, and PBM/SVM binding site search. (A) Venn analysis of genes: bound by HNF4α in primary human hepatocytes (H4 ChIP); down-regulated in expression profiling by HNF4α siRNA in HepG2 cells (H4 RNAi) (Fig. 5); and containing a potential HNF4α-binding site as determined by an exact match search using PBM2 results of annotated human genes (UCSC hg18) −2 kb to +1 kb relative to the TSS (PBM2 search). Shown are the number of genes; genes in the intersection are likely to be direct targets of HNF4α. (B) As in (A) except with SVM2 search of annotated human genes with four or more sites. (See Supporting Tables 6A and 6B for a complete list of the 198 and 135 genes in the intersection of the Venn diagrams in (A) and (B), respectively.) (C) Sampling of new HNF4α target genes that are bound in vivo, down-regulated in HNF4α knockdown, and containing ≥1 PBM or ≥4 SVM sites. Functions classically associated with HNF4α are shown as well as new functional categories. ID, Entrez Gene ID; Symbol, Official Gene Symbol. (See Supporting Tables 7A and 7B for a complete listing of all human genes with one or more PBM sites and four or more SVM sites, respectively.)
Fig. 8
Fig. 8
Illustration of select new HNF4α target genes down-regulated in RNAi, bound in vivo, and with PBM or SVM HNF4α-binding sites. Screenshots from Integrated Genome Browser of HNF4α ChIP-chip signals from primary human hepatocytes in promoter regions with PBM (closed triangle) sites indicated. SVM sites (open triangle) are indicated only for those genes lacking a PBM site in the region shown. ChIP signals are all statistically significant. Numbers are chromosome coordinates from UCSC hg18. Not all shots are on the same scale. Classical (A) and new functions (B) as defined in Fig. 7c are indicated.

Comment in

Similar articles

Cited by

References

    1. Bolotin E, Schnabl J, Sladek F. HNF4A (Homo sapiens) Transcription Factor Encyclopedia. 2009 http://www.cisreg.ca/tfe.
    1. Sladek FM, Zhong WM, Lai E, Darnell JE., Jr Liver-enriched transcription factor HNF-4 is a novel member of the steroid hormone receptor superfamily. Genes Dev. 1990;4:2353–2365. - PubMed
    1. Hayhurst GP, Lee YH, Lambert G, Ward JM, Gonzalez FJ. Hepatocyte nuclear factor 4alpha (nuclear receptor 2A1) is essential for maintenance of hepatic gene expression and lipid homeostasis. Mol Cell Biol. 2001;21:1393–1403. - PMC - PubMed
    1. Watt AJ, Garrison WD, Duncan SA. HNF4: a central regulator of hepatocyte differentiation and function. Hepatology. 2003;37:1249–1253. - PubMed
    1. Gupta RK, Kaestner KH. HNF-4alpha: from MODY to late-onset type 2 diabetes. Trends Mol Med. 2004;10:521–524. - PubMed

Publication types

Substances