Comparative Study
. 2009 Dec 5;9(13):5.1-11.
doi: 10.1167/9.13.5.

A (fascinating) litmus test for human retino- vs. non-retinotopic processing

Affiliations
Comparative Study

A (fascinating) litmus test for human retino- vs. non-retinotopic processing

Marco Boi et al. J Vis. .

Abstract

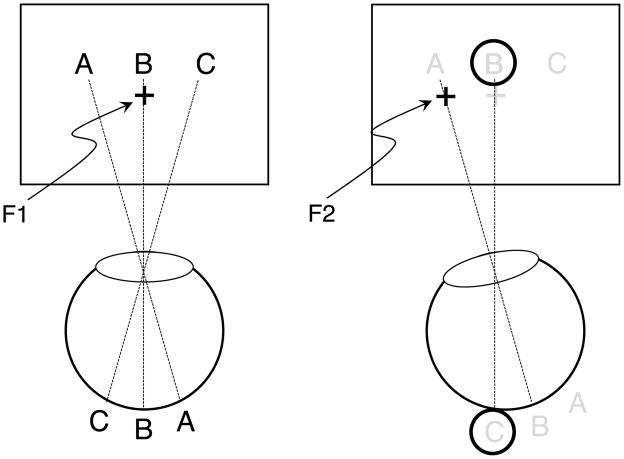
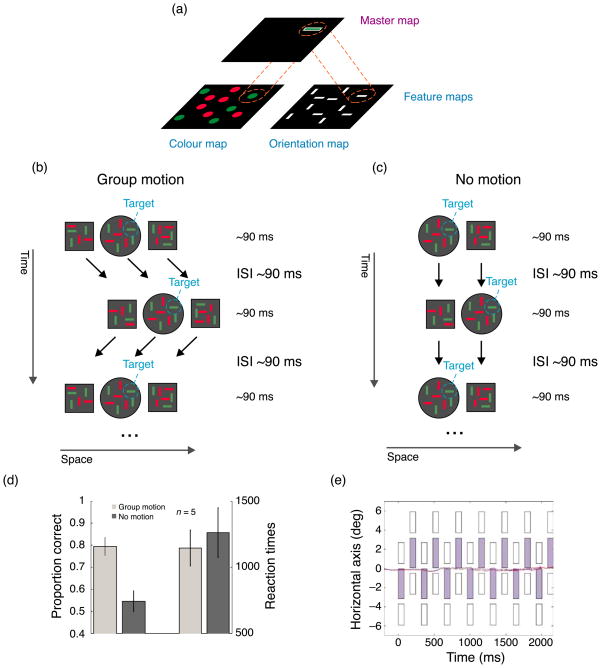
In human vision, the optics of the eye map neighboring points of the environment onto neighboring photoreceptors in the retina. This retinotopic encoding principle is preserved in the early visual areas. Under normal viewing conditions, due to the motion of objects and to eye movements, the retinotopic representation of the environment undergoes fast and drastic shifts. Yet, perceptually our environment appears stable suggesting the existence of non-retinotopic representations in addition to the well-known retinotopic ones. Here, we present a simple psychophysical test to determine whether a given visual process is accomplished in retino- or non-retinotopic coordinates. As examples, we show that visual search and motion perception can occur within a non-retinotopic frame of reference. These findings suggest that more mechanisms than previously thought operate non-retinotopically. Whether this is true for a given visual process can easily be found out with our "litmus test."


Figures

Figure 1
Figure 1
The saccadic stimulus presentation paradigm (SSPP). Observers are asked to make a saccadic eye movement from F1 to F2. Just before the initiation of the eye movement, a stimulus, such as the letter array A, B, C, is displayed briefly (left panel). As soon as the eye reaches its saccadic end point F2 (right panel), a second stimulus, e.g., a ring, is displayed briefly. For reference, the light gray letters and the cross in the right panel indicate the position of the first stimulus array, which was extinguished at the start of the eye movement. According to spatiotopic coordinates, the ring surrounds letter B, while in retinotopic coordinates the ring surrounds letter C. By investigating the perceived position of the ring relative to the letters or the suppressive effect of the ring on the letter array (metacontrast), one can determine whether these processes are retinotopic or non-retinotopic.
Figure 2
Figure 2
A typical Ternus–Pikler display. Three disks in a first frame are followed by an ISI and a second frame, where the disks are shifted one position to the right. Accordingly, the leftmost disk in the second frame spatially overlaps with the central disk of the first frame. Then, another ISI of the same duration as before follows and the sequence starts again from the first frame. (a) The three disks are perceived to move as a group if the ISI is 100 ms or longer (see arrows). (b) Only the outer disks are perceived to move if the ISI is 0 ms. The two central disks appear stationary. (c) Regardless of the ISI, no motion is perceived when the outer disks are removed. See Videos 1–3.
Figure 3
Figure 3
Ternus motion. (a) A dot was inserted in each of the disks in Figure 2. The outer disks contained a dot in the center in each frame. In the central disk, a dot was shifted frame to frame on the trajectory of a clockwise rotation. With an ISI of 210 ms, three disks were perceived moving as a group. In the central disk, the dot appears to rotate in a clockwise direction (Video 4 for a dense motion sampling, Video 5 for a coarser sampling as used in the quantitative experiment). This apparent rotation can only be detected by motion detectors that operate on non-retinotopic coordinates. This becomes perceptually immediately clear when group motion is obliterated as shown in (b). (b) The ISI was set to 0 ms so that no group motion was perceived. The percept is one of four disks, of which the outer ones jump back and forth (or flickered). The dots in the two central disks appear to move up and down (left center disk) or right and left (right center disk; Video 6). (c) As with element motion, the dots in the central disks are perceived to move up and down or left and right (Video 7). (d) Proportion correct for the three conditions. When group motion (“Gr. m.”) was perceived (ISI 210 ms), performance was significantly better than in the other two conditions (“El. m.,” “No m.”). (e) Observers’ eye movements were negligible. Average horizontal eye movement pattern during stimulus presentation for one observer under group motion condition (ISI 210 ms): display motion direction is rightward, the dot motion direction is clockwise and dot initial position is top. The light gray rectangles represent the space–time diagram of the horizontal position of the central disk of the stimulus, the white ones, the position of the lateral elements. The dot position within the disk is shown by the small dark gray rectangles; 95% confidence intervals are shown by the light gray lines flanking the dark gray line.
Figure 4
Figure 4
Ternus adaptation. Squares carried Gabor patches whose carriers drifted either upward or downward for the duration of one frame of 200 ms, as indicated by the white arrows (not presented in the actual stimulus display). With an ISI of 200 ms, group motion of three squares was perceived (Videos 8 and 9). (a) In the “retinotopic” condition, Gabors were arranged in such a way that the Gabor in the central square was perceived to be drifting alternately upward and downward from frame to frame (as indicated by the white up–down arrow). Retinotopically, coherent drift motion was presented (the direction of drift for the Gabors positioned to the left of the virtual midline was always opposite to the direction of drift for the Gabors positioned to the right of the midline; the midline, indicated by the dotted line, was not shown in the actual display). The retinotopic coherent drift motion is invisible to the observer because non-retinotopic, coherent motion is perceived. To test for motion aftereffect (MAE), two squares were presented as test stimuli after the offset of the Ternus–Pikler display. A strong MAE was observed. (b) In the “non-retinotopic” condition, Gabors were arranged in such a way that, retinotopically, Gabors drifted in different directions from one frame to the other. Perceptually, a coherent upward or downward drift was perceived in each square. Only a very weak MAE occurred. (c) MAE for conditions (a) and (b).
Figure 5
Figure 5
Ternus search. (a) Feature integration theory. Features are coded in retinotopic feature maps, one map for each basic feature dimension. To bind features together, a master map operates on the feature maps. If, for example, a green, horizontal line has to be searched for, the master map “checks” whether there is a “green” entry in the color map and a “horizontal” entry in the orientation map at the same retinotopic location in each map. (b) On each square and the central disk, a different search display was presented. The squares and the disk were shifted by one inter-element spacing back and forth. Five observers searched for a green, horizontal line in the central disk. Because of group motion and the corresponding non-retinotopic integration, search is quite accurate in the group motion condition (see (d)). (c) When the outer squares are omitted, group motion is obliterated and “integration” is retinotopic. This creates strong masking effects because different search displays alternate at each retinotopic location. (d) Results. Accuracy is higher and reaction times are faster for the group motion condition compared to the no motion condition. (e) There are virtually no (horizontal) eye movements during visual search when group motion is perceived. Data from one naive observer (the data from the other observer, author MB, are very similar). The stimulus layout is plotted as in Figure 3e.

References

    1. Bach M. The Freiburg Visual Acuity test-automatic measurement of visual acuity. Optometry and Vision Science. 1996;73:49–53. - PubMed
    1. Bertamini M, Proffitt DR. Hierarchical motion organization in random dot configurations. Journal of Experimental Psychology. 2000;26:1371–1386. - PubMed
    1. Cavanagh P, Holcombe AO, Chou W. Mobile computation: Spatiotemporal integration of the properties of objects in motion. Journal of Vision. 2008. pp. 1pp. 1–23. http://journalofvision.org/8/12/1/10.1167/8.12.1. - DOI - PMC - PubMed
    1. Davidson ML, Fox M, Dick AO. Effect of eye movements on backward masking and perceived location. Perception & Psychophysics. 1973;14:110–116.
    1. d’Avossa G, Tosetti M, Crespi S, Biagi L, Burr DC, Morrone MC. Spatiotopic selectivity of BOLD responses to visual motion in human area MT. Nature Neuroscience. 2007;10:249–255. - PubMed

Publication types