Comparative Study
. 2009 Dec 9;9(13):11.1-37.
doi: 10.1167/9.13.11.

Latitude and longitude vertical disparities

Affiliations
Comparative Study

Latitude and longitude vertical disparities

Jenny C A Read et al. J Vis. .

Abstract

The literature on vertical disparity is complicated by the fact that several different definitions of the term "vertical disparity" are in common use, often without a clear statement about which is intended or a widespread appreciation of the properties of the different definitions. Here, we examine two definitions of retinal vertical disparity: elevation-latitude and elevation-longitude disparities. Near the fixation point, these definitions become equivalent, but in general, they have quite different dependences on object distance and binocular eye posture, which have not previously been spelt out. We present analytical approximations for each type of vertical disparity, valid for more general conditions than previous derivations in the literature: we do not restrict ourselves to objects near the fixation point or near the plane of regard, and we allow for non-zero torsion, cyclovergence, and vertical misalignments of the eyes. We use these expressions to derive estimates of the latitude and longitude vertical disparities expected at each point in the visual field, averaged over all natural viewing. Finally, we present analytical expressions showing how binocular eye position-gaze direction, convergence, torsion, cyclovergence, and vertical misalignment-can be derived from the vertical disparity field and its derivatives at the fovea.


Figures

Figure 1
Figure 1
Two coordinates systems for describing head-centric or optic-array disparity. Red lines are drawn from the two nodal points L, R to an object P. A: Helmholtz coordinates. Here, we first rotate up through the elevation angle λ to get us into the plane LRP, and the azimuthal coordinate ζ rotates the lines within this plane until they point to P. The elevation is thus the same for both eyes; no physical object can have a vertical disparity in optic-array Helmholtz coordinates. B: Fick coordinates. Here, the azimuthal rotation ζ is applied within the horizontal plane, and the elevation λ then lifts each red line up to point at P. Thus, elevation is in general different for the two lines, meaning that the object P has a vertical disparity in optic-array Fick coordinates.
Figure 2
Figure 2
Different retinal coordinate systems. A: Cartesian planar. Here, the x and y refer to position on the virtual plane behind the retina; the “shadow” shows where points on the virtual plane correspond to on the retina, i.e. where a line drawn from the virtual plane to the center of the eyeball intersects the eyeball. B: Azimuth-longitude/elevation-longitude. C: Azimuth-longitude/elevation-latitude. D: Azimuth-latitude/elevation-longitude. E: Azimuth-latitude/elevation-latitude. For the angular coordinate systems (B-E), lines of latitude/longitude are drawn at 15° intervals between ±90°. For the Cartesian system (A), the lines of constant x and y are at intervals of 0.27=tan15°. Lines of constant x are also lines of constant α, but lines that are equally spaced in x are not equally spaced in α.
Figure 3
Figure 3
Two definitions of vertical retinal disparity. AB) A point in space, P, projects to different positions IL and IR on the two retinae. CD) The two retinae are shown superimposed, with the two half-images of P shown in red and blue for the left and right retinae respectively. In (AC), the retinal coordinate system is azimuth-longitude/elevation-longitude. In (BD), it is azimuth-longitude/elevation-latitude. The point P and its images IL and IR are identical between (AC) and (BD); the only difference between left and right halves of the figure is the coordinate system drawn on the retinae. The eyes are converged 30° fixating a point on the midline: X=0, Y=0, Z=11. The plane of gaze, the XZ plane, is shown in gray. Lines of latitude and longitude are drawn at 15° intervals. The point P is at X=−6, Y=7, Z=10. In elevation-longitude coordinates, the images of P fall at ηL=−30°, ηR=−38°, so the vertical disparity ηΔ is −8°. In elevation-latitude, κL=−27°, κR=−34°, and the vertical disparity κΔ=−6°. This figure was generated by Fig_VDispDefinition.m in the Supplementary Material.
Figure 4
Figure 4
Helmholtz coordinates for eye position, (a) shown as a gimbal, after Howard (2002) Fig. 9.10, (b) shown for the cyclopean eye. The sagittal YZ plane is shown in blue, the horizontal XZ plane in pink, and the gaze plane in yellow. There are two ways of interpreting Helmholtz coordinates: (1) Starting from primary position, the eye first rotates through an angle T about an axis through the nodal point parallel to Z, then through H about an axis parallel to Y, and finally through V about an axis parallel to X. Equivalently (2), starting from primary position, the eye first rotates downwards through V, bringing the optic axis into the desired gaze plane (shown in yellow) then rotates through H about an axis orthogonal to the gaze plane, and finally through T about the optic axis.
Figure 5
Figure 5
Different ways of measuring the distance to the object P. The two physical eyes are shown in gold; the cyclopean eye is in between them, in blue. F is the fixation point; the brown lines mark the optic axes, and the blue line the direction of cyclopean gaze. The point P is marked with a red dot. It is at a distance R from the origin. Its perpendicular projection on the cyclopean gaze axis is also drawn in red (with a corner indicating the right-angle); the distance of this projection from the origin is S, marked with a thick red line.
Figure 6
Figure 6
Expected vertical disparity in natural viewing, as a function of position in the cyclopean retina, for (a) elevation-longitude and (b) elevation-latitude definitions of vertical disparity. Vertical disparity is measured in units of <​HΔ>, the mean convergence angle. Because the vertical disparity is small over much of the retina, we have scaled the pseudocolor as indicated in the color-bar, so as to concentrate most of its dynamic range on small values. Contour lines show values in 0.1 steps from −1 to 1.
Figure 7
Figure 7
Vertical disparity field all over the retina, where the visual scene is a frontoparallel plane, i.e. constant head-centered coordinate Z. AB: Z=60cm; CD: Z=10m. The interocular distance was 6.4cm, gaze angle Hc=15° and convergence angle HΔ=5.7°, i.e. such as to fixate the plane at Z=60cm. Vertical disparity is defined as difference in (AC) elevation-longitude, (BD) elevation-latitude. Lines of azimuth-longitude and (AC) elevation-longitude, (BD) elevation-latitude are marked in black in 15° intervals. The white line shows where the vertical disparity is zero. The fovea is marked with a black dot. The same pseudocolor scale is used for all four panels. Note that the elevation-longitude disparity, ηΔ, goes beyond the colorscale at the edges of the retina, since it tends to infinity as |αc| tends to 90°. This figure was generated by DiagramOfVerticalDisparity_planes.m in the Supplementary Material.
Figure 8
Figure 8
Epipolar line and how it differs from the “line of possible disparities” shown in Figure 9. A: How an epipolar line is calculated: it is the set of all possible point on the right retina (heavy blue curve) which could correspond to the same point in space as a given point on the left retina (red dot). B: Epipolar line plotted on the planar retina. Blue dots show 3 possible matches in the right eye for a fixed point in the left retina (red dot). The cyclopean location or visual direction (mean of left and right retinal positions, black dots) changes as one moves along the epipolar line. C: Possible matches for a given cyclopean position (black dot). Here, we keep the mean location constant, and consider pairs of left/right retinal locations with the same mean. D: Line of possible disparities implied by the matches in B. These are simply the vectors linking left to right retinal positions for each match (pink lines). Together, these build up a line of possible disparities (green line).
Figure 9
Figure 9
The thick green line shows the line of two-dimensional disparities that are physically possible for real objects, for the given eye posture (specified by convergence HΔ and gaze azimuth Hc) and the given visual direction (specified by retinal azimuth αc and elevation κc). The green dot shows where the line terminates on the abscissa. For any given object, where its disparity falls on the green line depends on the distance to the object at this visual direction. The white circle shows one possible distance. Although, for clarity, the green line is shown as having quite a steep gradient, in reality it is very shallow close to the fovea. Thus, it is often a reasonable approximation to assume that the line is flat in the vicinity of the distance one is considering (usually the fixation distance), as indicated by the horizontal green dashed line. This is considered in more detail in the next section.
Figure 10
Figure 10
Partial differentiation on the retina. The cyclopean retina is shown colored to indicate the value of the vertical disparity field at each point. Differentiating with respect to elevation κ while holding azimuth constant means finding the rate at which vertical disparity changes as one moves up along a line of azimuth-longitude, as shown by the arrow labeled ∂/∂κ. Differentiating with respect to azimuth a, while holding elevation constant, means finding the rate of change as one moves around a line of elevation-latitude.
Figure 11
Figure 11
Scatterplots of estimated eye position parameters against actual values, both in degrees, for 1000 different simulated eye positions. Black lines show the identity line. Some points with large errors fall outside the range of the plots, but the quoted median absolute errors are for all 1000 simulations. On each simulation run, eye position was estimated as follows. First, the viewed surface was randomly generated. Head-centered X and Y coordinates were generated randomly near the fixation point (XF,YF,ZF). Surface Z-coordinates were generated from Zd = Σij aijXdiYdj, where Xd is the X-position relative to fixation, Xd=X-XF (Yd, Zd similarly, all in cm), i and j both run from 0 to 3, and the coefficients aij are picked from a uniform random distribution between ±0.02 on each simulation run. This yielded a set of points on a randomly-chosen smooth 3D surface near fixation. These points were then projected to the retinas, and the vertical disparity within 0.5° of the fovea was fitted with a parabolic surface. This simulation is Matlab program ExtractEyePosition.m in the Supplementary Material.
Figure 12
Figure 12
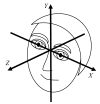
Head-centered coordinate system used throughout this paper. The origin is the point midway between the two eyes. The X axis is defined by the nodal points of the two eyes, and points rightwards. The orientation of the XZ plane is defined by primary position, but is approximately horizontal. The Y axis points upwards and the Z axis points in front of the observer.

Similar articles

Cited by

References

    1. Adams W, Frisby JP, Buckley D, Garding J, Hippisley-Cox SD, Porrill J. Pooling of vertical disparities by the human visual system. Perception. 1996;25(2):165–176. - PubMed
    1. Allison RS, Rogers BJ, Bradshaw MF. Geometric and induced effects in binocular stereopsis and motion parallax. Vision Res. 2003;43(17):1879–1893. - PubMed
    1. Backus BT, Banks MS. Estimator reliability and distance scaling in stereoscopic slant perception. Perception. 1999;28(2):217–242. - PubMed
    1. Backus BT, Banks MS, van Ee R, Crowell JA. Horizontal and vertical disparity, eye position, and stereoscopic slant perception. Vision Res. 1999;39(6):1143–1170. - PubMed
    1. Banks MS, Backus BT. Extra-retinal and perspective cues cause the small range of the induced effect. Vision Res. 1998;38(2):187–194. - PubMed

Publication types