Review
. 2010:61:219-40.
doi: 10.1146/annurev.physchem.012809.103457.

Functional motifs in biochemical reaction networks

Affiliations
Review

Functional motifs in biochemical reaction networks

John J Tyson et al. Annu Rev Phys Chem. 2010.

Abstract

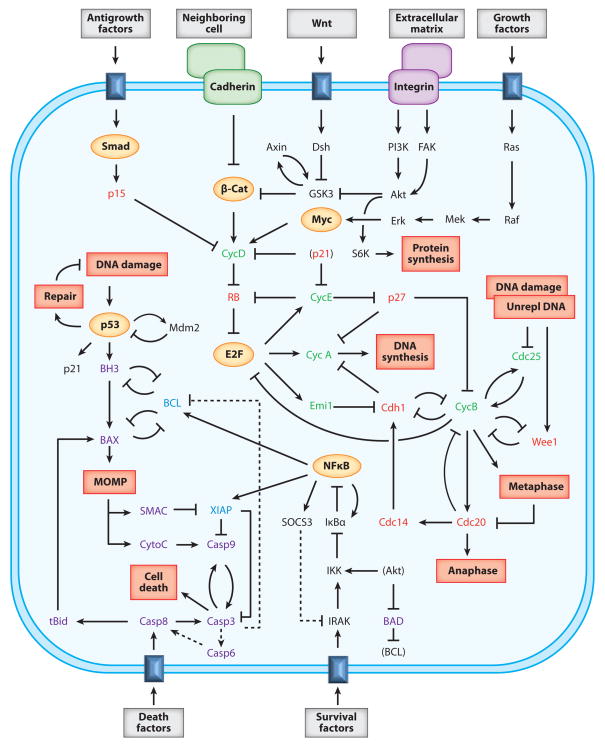
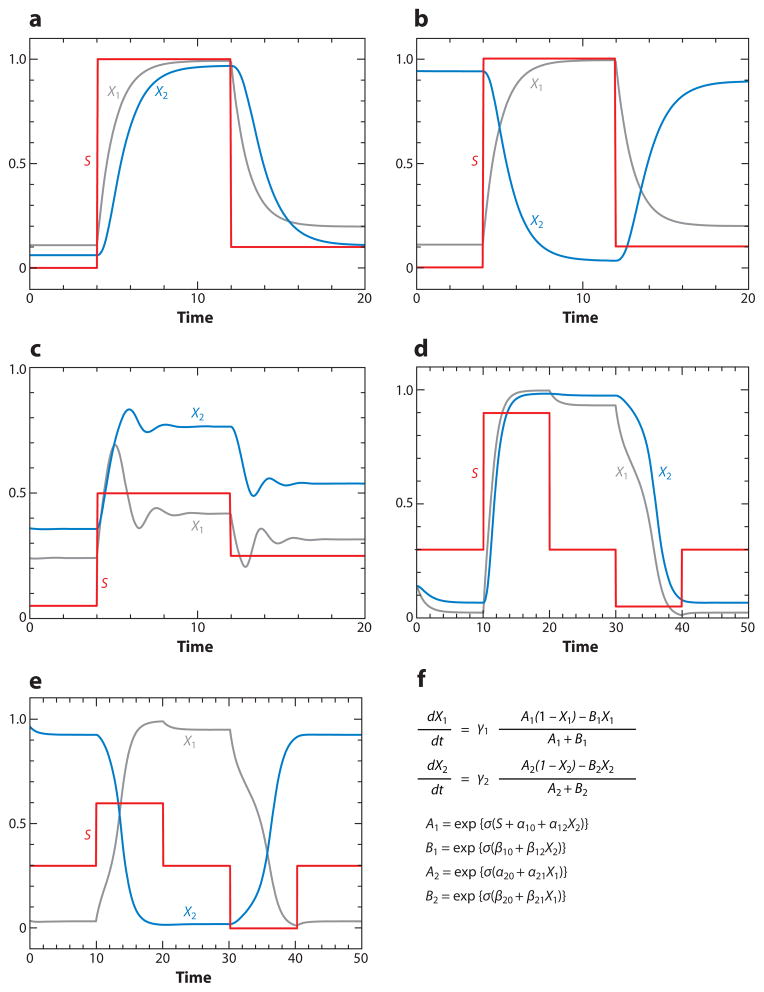
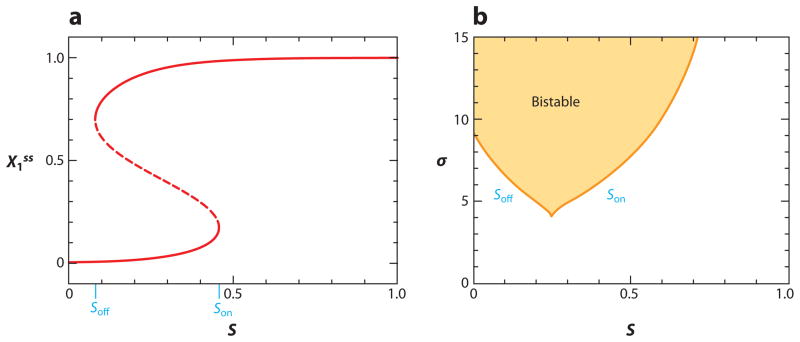
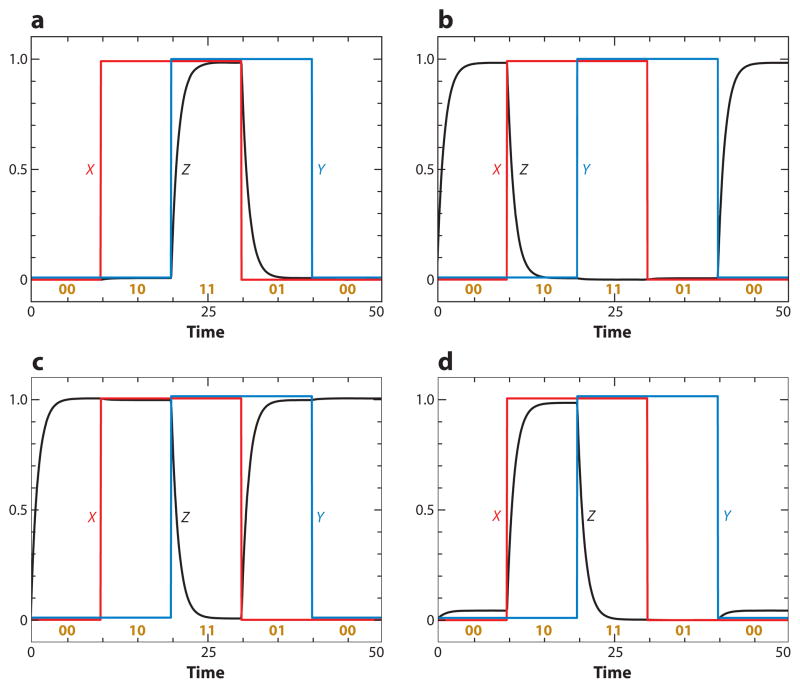
The signal-response characteristics of a living cell are determined by complex networks of interacting genes, proteins, and metabolites. Understanding how cells respond to specific challenges, how these responses are contravened in diseased cells, and how to intervene pharmacologically in the decision-making processes of cells requires an accurate theory of the information-processing capabilities of macromolecular regulatory networks. Adopting an engineer's approach to control systems, we ask whether realistic cellular control networks can be decomposed into simple regulatory motifs that carry out specific functions in a cell. We show that such functional motifs exist and review the experimental evidence that they control cellular responses as expected.


Figures

Figure 1
Figure 1
Some representative information-processing systems in a cell. The dark blue rectangles embedded in the cell membrane are receptors for external signal molecules (gray boxes). The components in yellow ovals are transcription factors. Proteins that promote (green) or repress (red) progression through the cell cycle are indicated, as well as proteins that promote (purple) or repress (blue) programmed cell death. Red boxes inside the cell indicate internal signals (DNA damage, unreplicated DNA) and responses (e.g., repair, DNA synthesis, and cell death). Dashed lines indicate questionable interactions. MOMP, mitochondrial outer-membrane permeability.
Figure 2
Figure 2
Functional properties of two-component phosphoprotein interaction networks. We are solving Equation 4 for N = 2 and selected values of the interaction parameters αij and βij (see Supplemental Table 2 for parameter values). In each case, the signal (red line) is added to the parameter α10; i.e., the signal provides an external activation of the motif. (a) Transducer: SX1X2. (b) Inverter: SX1X2. (c) Homeostasis [negative feedback loop (FBL)]. If we consider X1(t) as the response, then we see that the steady-state response varies over a much smaller range of values than the range of input signals. (d) Toggle switch (positive FBL). (e) Toggle switch (double-negative FBL). In the neutral position (S = 0.3) of a toggle switch, it may persist in one or the other of two stable steady states (on or off ). The switch can be flipped from one state to the other by toggling the signal up and down from its neutral position. (f) The differential equations (Equation 3) for the two-component motifs in Table 1.
Figure 3
Figure 3
Bifurcation diagrams for the double-negative toggle switch. (a) One-parameter bifurcation diagram. Plotting X1ss as a function of S, we see that the toggle switch is indeed bistable for S = 0.3. By raising S above Son ≈ 0.46, we can be sure the switch is on. Once the switch is on, we must lower S below Soff ≈ 0.08 to flip it off. Son and Soff are known as saddle-node bifurcation points. (b) This two-parameter bifurcation diagram illustrates how the bifurcation points, Son and Soff, depend on a second parameter, in this case, σ, the steepness of the nonlinear functions in Equation 4.
Figure 4
Figure 4
Some logic gates (Motif 8 in Table 2): (a) AND, (b) NOR, (c) NAND, and (d) NOT(A → B). Parameter values are provided in Supplemental Table 3. The two input signals (X and Y) are plotted in red and blue, respectively, and the output (Z) is in black. The numbers 00, 10, 11, and 01 indicate the states of the input signals.
Figure 5
Figure 5
Oscillations in three-component negative feedback loops (FBLs) (Motifs 10, 18, and 19 in Table 2). Parameter values are given in Supplemental Table 4. (a) Oscillations of a simple negative FBL (Motif 10) for S = 0.6. (b) One-parameter bifurcation diagram for Motif 10. Oscillations exist in the interval SHB1 < S < SHB2. The end points are known as Hopf bifurcation (HB) points. (c) Two-parameter bifurcation diagram for Motif 10 shows an oscillatory region bounded by an HB locus for σ > 8. (d) The interval of oscillations, SHB1 < S < SHB2, shrinks as α23 increases; i.e., Motif 10 morphs into Motif 18. (e) Oscillations of Motif 18 for S = 0.6 and α23 = 0.4. Compared with panel a, the amplitude and period of oscillation decrease as α23 increases. (f) Oscillations of Motif 19 for S = 0.6 and β23 = 0.6. Compared with panel a, the amplitude and period of oscillation increase as β23 increases. (g) One-parameter bifurcation diagram for Motif 19 at S = 0.9. Oscillations commence at an HB at β23 = 0.2765 and end at an infinite-period bifurcation at β23 = 0.7018. (h) Two-parameter bifurcation diagram for Motif 19. The oscillatory domain is bounded on the left and right by loci of HBs and at the top by a locus of infinite-period (IP) bifurcations. The motif has three steady states in the wedge-shaped region in the upper-right corner, but it is bistable only in the shaded region to the right of the HB locus.
Figure 6
Figure 6
Alternative responses of incoherent feed-forward loops (Motif 12 in Table 2): (a) sniffer and (b) trigger. Parameter values are provided in Supplemental Table 4.
Figure 7
Figure 7
Tristability (Motif 13 in Table 2). Parameter values are provided in Supplemental Table 4. (a) One-parameter bifurcation diagram for σ = 8, with three stable steady states for S in the vicinity of 0.5. (b) Two-parameter bifurcation diagram; tristability exists in the narrow strip where the two cusp-shaped regions overlap.
Figure 8
Figure 8
Oscillations in an activator-amplified negative feedback loop (Motif 15 in Table 2): (a) oscillations at S = 0 and (b) one-parameter bifurcation diagram. Parameter values are provided in Supplemental Table 4.
Figure 9
Figure 9
Signal transduction and inversion in the Wee1-CycB-Cdc25 axis. (a) Wee1 phosphorylation and (b) Cdc25 phosphorylation by cyclin B–dependent kinase (a dimer of CycB and Cdk1) in frog-egg extracts. In each panel, the experimental data are fitted to a Hill function with exponent nH . Because phospho-Wee1 is the inactive form and phospho-Cdc25 is the active form, panel a is an example of signal inversion and panel b of signal transduction. In the case of Wee1, Kim & Ferrell (27) presented evidence that the sigmoidal response curve results from competitive binding of CycB/Cdk1 to some other proteins in the extract. In the case of Cdc25, J.E. Ferrell (private communication) has evidence that the sigmoidal response curve results from multisite phosphorylation of Cdc25. Data in panel a from Reference , used by permission; unpublished data in panel b from J.E. Ferrell, used by permission.
Figure 10
Figure 10
MPF oscillations in frog-egg extracts. MPF is a dimer of CycB and Cdk1 and can be inactivated by phosphorylation of the Cdk1 subunit by Wee1, and activated by the removal of the phosphate group by Cdc25. (a) Cyclin B protein (red) and MPF activity (dark blue) are measured at 2-min intervals. (b) The data are plotted (parametrically in time) on the MPF-cyclin phase plane. The trajectory traces out a limit cycle, exactly as predicted by Motif 15 in Table 2. (c) Same as panel a, except that the authors have pooled the results of many experiments run for longer periods of time. (d) Same as panel c, except that the positive feedback loop has been weakened by supplementing the extract with a nonphosphorylable form of Cdk1. Data from Reference , used by permission.
Scheme 1
Scheme 1
Scheme 2
Scheme 2

Similar articles

Cited by

References

    1. Bray D. Protein molecules as computational elements in living cells. Nature. 1995;376:307–12. - PubMed
    1. Alon U. Network motifs: theory and experimental approaches. Nat Rev Genet. 2007;8:450–61. - PubMed
    1. Alon U. An Introduction to Systems Biology: Design Principles of Biological Circuits. Boca Raton, FL: Chapman & Hall/CRC; 2007.
    1. Thomas R, D’Ari R. Biological Feedback. Boca Raton, FL: CRC; 1990.
    1. Wolf DM, Arkin AP. Motifs, modules and games in bacteria. Curr Opin Microbiol. 2003;6:125–34. - PubMed

Publication types

LinkOut - more resources