Review
. 2010:61:111-28.
doi: 10.1146/annurev.physchem.012809.103500.

Subcellular dynamics and protein conformation fluctuations measured by Fourier imaging correlation spectroscopy

Affiliations
Review

Subcellular dynamics and protein conformation fluctuations measured by Fourier imaging correlation spectroscopy

Eric N Senning et al. Annu Rev Phys Chem. 2010.

Abstract

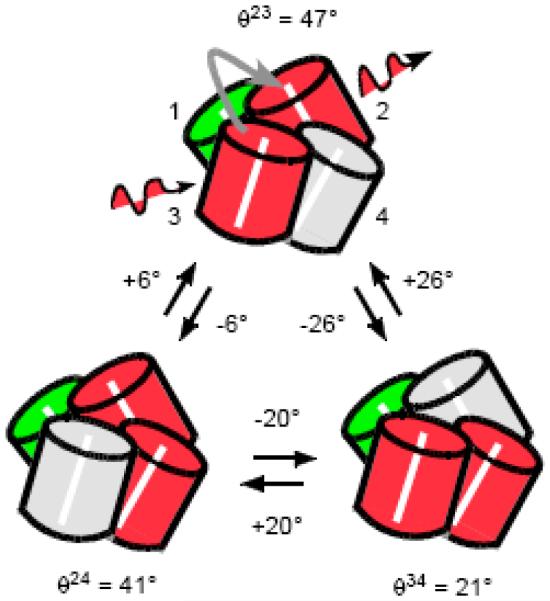
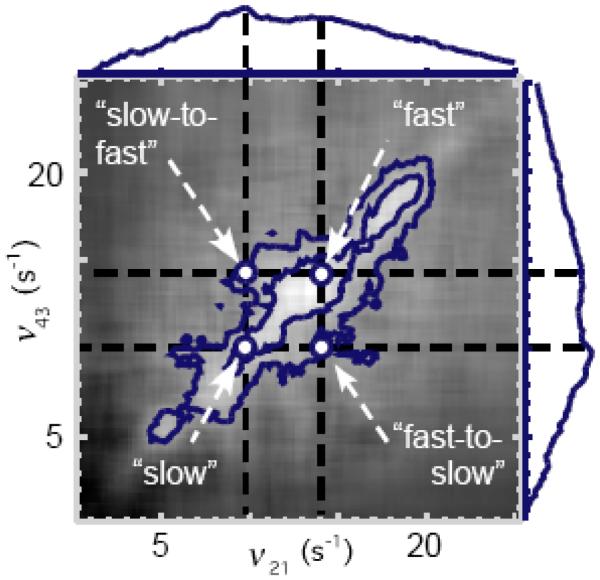
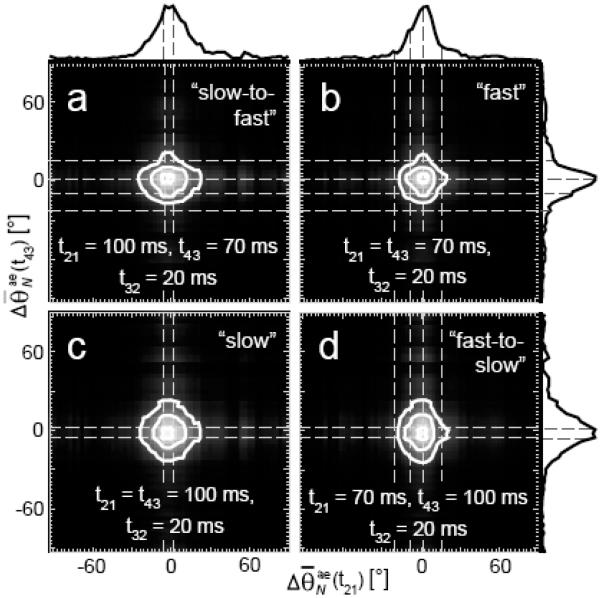
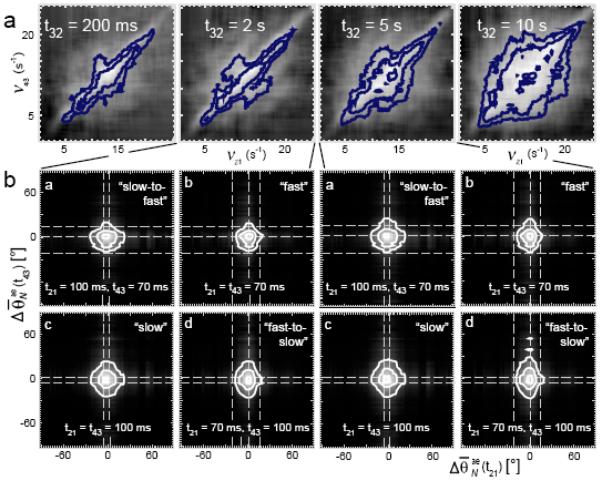
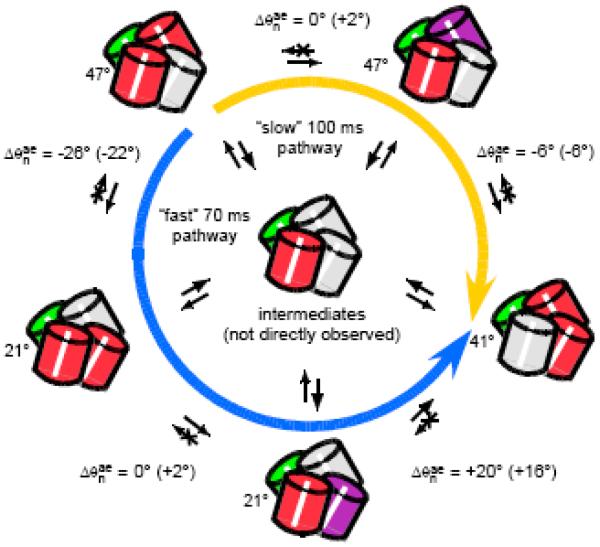
Novel high signal-to-noise spectroscopic experiments that probe the dynamics of microscopic objects have the potential to reveal complex intracellular biochemical mechanisms, or the slow relaxations of soft matter systems. This article reviews the implementation of Fourier imaging correlation spectroscopy (FICS), a phase-selective approach to fluorescence fluctuation spectroscopy that employs a unique route to elevate signal levels while acquiring detailed information about molecular coordinate trajectories. The review demonstrates the broad applicability of FICS by discussing two recent studies. The dynamics of Saccharomyces cerevisiae yeast mitochondria are characterized with FICS and provide detailed information about the influence of specific cytoskeletal elements on the movement of this organelle. In another set of experiments, polarization-modulated FICS captures conformational dynamics and molecular translational dynamics of the fluorescent protein DsRed, and analyses by four-point correlation and joint distribution functions of the corresponding data reveal statistically meaningful pathways of DsRed switching between different optical conformations.


Figures

Figure 1
Figure 1
Rendering of an FCS experiment. Two particles travel into the excitation volume at the focal point in the sample and cause a fluctuation in the emitted fluorescence. The zoomed-in portion to the right depicts the random path of each fluorescent particle as it travels through the excitation volume.
Figure 2
Figure 2
Schematic diagram of the optical layout for FICS experiments, performed on fluorescently labeled yeast mitochondria. (a) The sample is placed at the focal plane of a fluorescence microscope. The excitation beams (light gray lines) are sent to a focusing objective using a dichroic beam-splitter, and create a spatially modulated intensity grating at the sample. The spatially integrated fluorescence (dark gray lines) is collected by the same objective and focused onto a photo-detector. (b) Condensed view of the focused laser spot with beam waist ~ 50 µm. (c) Fluorescently labeled mitochondrial filaments, represented as N interconnected gray disks, are excited by the optical grating with fringe spacing dG. Signal fluctuations occur as mitochondrial filaments move relative to one another. (d) Schematic of the total fluorescence intensity I f as a function of the grating phase ϕG. The modulated component of the signal has phase γk. (e) The signal phase is proportional to the mean position xN(t) of the sampled particle distribution PN [x;t]. The sampled distribution is a time-dependent subset of the equilibrium distribution Peq (x). Figure adapted from Reference .
Figure 3
Figure 3
(a) Micrographs of fluorescently labeled yeast mitochondria (left column, red) and MFs (right column, green), under different cytoskeletal conditions. (b) MSD of mitochondrial fluctuations in healthy cells (black), cells treated with the f-actin inhibitor Latrunculin-A (green), and cells treated with the microtubule inhibitor Nocodazole (blue). Each set of curves represents measurements performed at a different length scale dG = 0.6 µm, 0.79 µm, 1.03 µm and 1.19 µm. For all of the length scales investigated, cells treated with Latrunculin-A show a pronounced decrease in mitochondrial mobility. A control measurement of a 0.5 µm colloid sample in viscous, concentrated sorbitol solution is presented at the top of the figure. Various lines with slopes representing the temporal scaling parameter α are also provided to guide the eye.
Figure 4
Figure 4
(a) Schematic diagram of the optical layout for polarization-modulated (PM-) FICS experiments, performed on DsRed fluorescent proteins in dilute viscous solution. Two orthogonal, elliptically polarized laser beams are crossed at the sample plane of a fluorescence microscope. The spatially and temporally integrated fluorescence is split using a polarizing beam-splitter (BS), and detected in parallel using two synchronized photon-counting detectors. (b) At the sample, the superposition of the two laser beams creates (simultaneously) a spatially modulated intensity interference pattern and a plane polarization grating. Molecular chromophores are depicted as white circles bisected by line segments, indicating the orientations of transition dipoles. (c) Each optical chromophore is characterized by its absorption and emission dipole moments (μ^ia and μ^ie, respectively), and its depolarization angle θiae. The two polarized emission signals are each projected onto orthogonal laboratory frame axes (labeled α^ and χ^). Figure adapted from Reference .
Figure 5
Figure 5
Optical conformational transitions of the ‘mature’ red chromophores in DsRed. DsRed is a tetrameric complex of cylindrically shaped fluorescent protein subunits, with relative orientations approximated in the figure. Each subunit has at its center an optical chromophore that can occupy one of two chemical states, corresponding to green or red emission. The green chromophores (shaded green) do not undergo chemical conversion to the red state on the time scales of our measurements. Red chromophores can interconvert on millisecond time scales between two highly luminescent “bright” states (shaded red), and one “dark” state (shaded gray). From the crystallographic structure of DsRed, the relative angles θae between adjacent absorption and emission transition dipole moments are known, and identified according to the numbering system shown on the top species. Polarization- and spectrally-selective excitation of the red chromophore subunits, mediated by electronic excitation transfer between coupled chromophores occupying adjacent sites, results in discrete transitions in the fluorescence depolarization angle Δθae. Figure adapted from Reference .
Figure 6
Figure 6
Logarithm of the two-dimensional spectral density of the mean depolarization angles SA(4)(V21,t32,V43), for waiting period t32 = 20 ms. Features along the diagonal line (labeled “fast” and “slow”) indicate the distribution of conformational transition rates, while off-diagonal features indicate molecular populations that “exchange” between conformational transition rates. Along the horizontal and vertical axes is projected the magnitude of the spectrum, evaluated at the diagonal ν21 = ν43. Contours are shown at 0.5 and 0.25 times the peak height. Figure adapted from Reference .
Figure 7
Figure 7
(a – d) Joint distributions of the sampled mean displacements of depolarization angles P(4)[ΔθNae(t43);ΔθNae(t21)], where the waiting period t32 = 20 ms, and t21, t43{70ms,100ms}, as shown. Selected features in the joint distributions (indicated by horizontal and vertical dashed gray lines) reflect temporally correlated transitions that participate in “fast” (~ 70 ms) and “slow” (~ 100 ms) conformational transition pathways. The magnitudes of the distributions are projected onto horizontal and vertical axes. Contours are shown at 0.9, 0.5, and 0.25 times the peak height. Figure adapted from Reference .
Figure 8
Figure 8
(a) Logarithm of the two-dimensional spectral density of the sampled mean depolarization angles SA(4)(V21,t32,V43), for t32 = 200 ms, 2 s, 5 s, and 10s. The transverse broadening indicates that the average exchange time scale of the anisotropy fluctuations is approximately the same as the mean relaxation time τA = 8 s. (b) Joint distributions P(4)[ΔθNae(t43);δθNae(t21)], with t32 = 2 s and 5 s. Figure adapted from Reference .
Figure 9
Figure 9
Possible model for the conformational transition pathways observed in DsRed. The structural and color conventions are the same as adopted in Fig. 1, except that the “far-red” chromophore state is indicated by purple shading. The measured displacements in the depolarization angle are shown in parentheses next to the expected values from the crystallographic data. The molecule undergoes temporally correlated (cooperative) transitions between different optically coupled conformations. There are distinct “fast” and “slow” transition pathways, operating on the 70 and 100 ms time scales, respectively (indicated by the blue and gold arrows). Intermediates lacking dipolar coupling, such as the one generically depicted at the center of the diagram, connects adjacent species. Exchange processes involve correlations between transitions that occur on separate pathways, and occur on the mean time scale of 8 s. Figure adapted from Reference .

Similar articles

Cited by

References

    1. Yang H, Luo G, Karnchanaphanurach P, Louie T-M, Rech I, Cova S, Xun L, Xie XS. Protein conformational dynamics probed by single-molecule electron transfer. Science. 2003;302:262–266. - PubMed
    1. Weiss S. Measuring conformational dynamics of biomolecules by single molecule fluorescence spectroscopy. Nat. Struct. Biol. 2000;7:724–729. - PubMed
    1. Grassman TJ, Knowles MK, Marcus AH. Structure and dynamics of fluorescently labeled complex fluids by fourier imaging correlation spectroscopy. Phys Rev E Stat Phys Plasmas Fluids Relat Interdiscip Topics. 2000;62(6 Pt B):8245–57. - PubMed
    1. Dixit R, Cyr R. Cell damage and reactive oxygen species production induced by fluorescence microscopy: effect on mitosis and guidelines for non-invasive fluorescence microscopy. Plant J. 2003;36(2):280–90. - PubMed
    1. Hopt A, Neher E. Highly nonlinear photodamage in two-photon fluorescence microscopy. Biophys J. 2001;80(4):2029–36. - PMC - PubMed

Publication types

MeSH terms

Substances

LinkOut - more resources