

Hepatic zonation of carbon and nitrogen fluxes derived from glutamine and ammonia transformations
- PMID: 20055990
- PMCID: PMC2843605
- DOI: 10.1186/1423-0127-17-1
Hepatic zonation of carbon and nitrogen fluxes derived from glutamine and ammonia transformations
Abstract
Background: Glutaminase predominates in periportal hepatocytes and it has been proposed that it determines the glutamine-derived nitrogen flow through the urea cycle. Glutamine-derived urea production should, thus, be considerably faster in periportal hepatocytes. This postulate, based on indirect observations, has not yet been unequivocally demonstrated, making a direct investigation of ureogenesis from glutamine highly desirable.
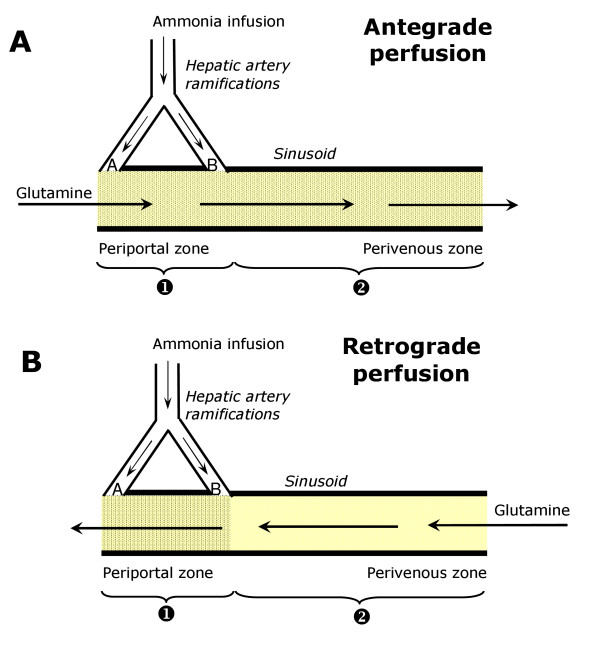
Methods: Zonation of glutamine metabolism was investigated in the bivascularly perfused rat liver with [U-14C]glutamine infusion (0.6 mM) into the portal vein (antegrade perfusion) or into the hepatic vein (retrograde perfusion).
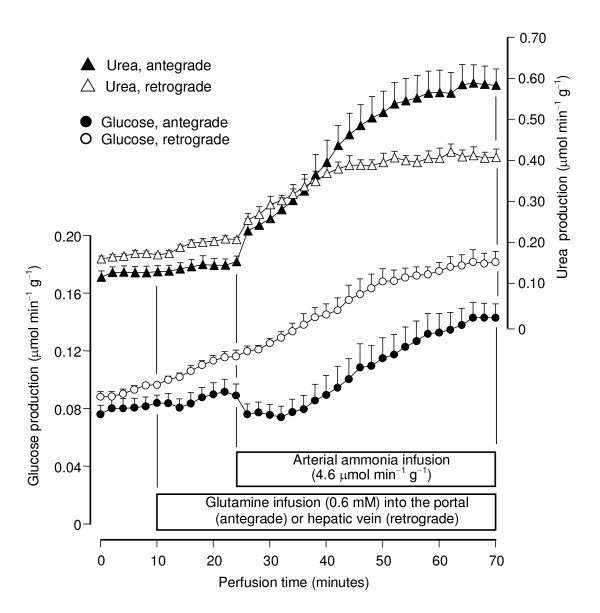
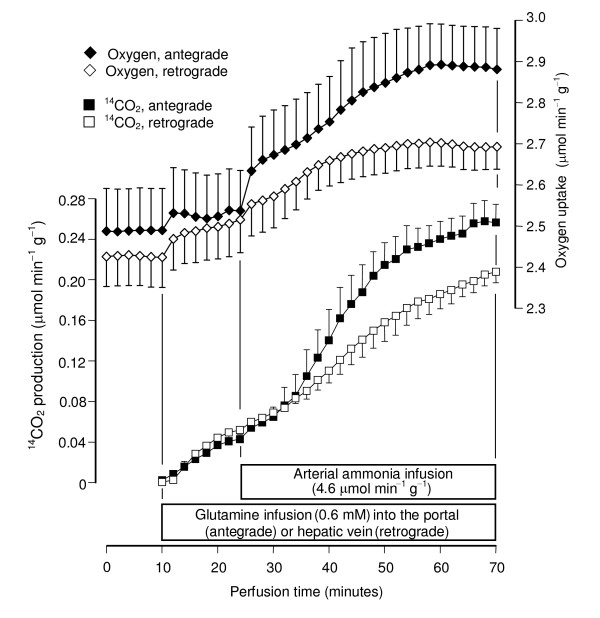
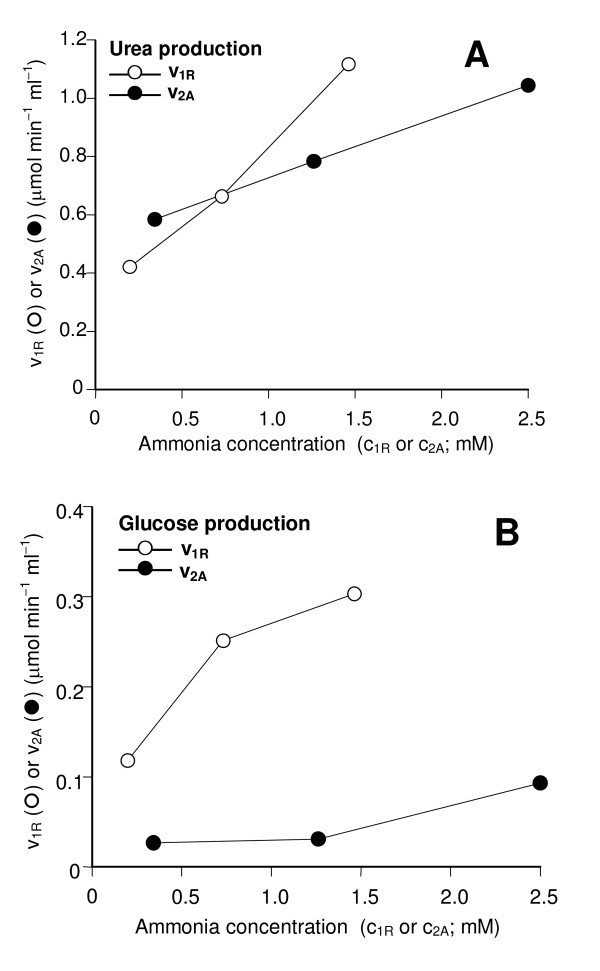
Results: Ammonia infusion into the hepatic artery in retrograde and antegrade perfusion allowed to promote glutamine metabolism in the periportal region and in the whole liver parenchyma, respectively. The results revealed that the space-normalized glutamine uptake, indicated by (14)CO(2) production, gluconeogenesis, lactate production and the associated oxygen uptake, predominates in the periportal region. Periportal predominance was especially pronounced for gluconeogenesis. Ureogenesis, however, tended to be uniformly distributed over the whole liver parenchyma at low ammonia concentrations (up to 1.0 mM); periportal predominance was found only at ammonia concentrations above 1 mM. The proportions between the carbon and nitrogen fluxes in periportal cells are not the same along the liver acinus.
Conclusions: In conclusion, the results of the present work indicate that the glutaminase activity in periportal hepatocytes is not the rate-controlling step of the glutamine-derived nitrogen flow through the urea cycle. The findings corroborate recent work indicating that ureogenesis is also an important ammonia-detoxifying mechanism in cells situated downstream to the periportal region.
Figures
Similar articles
-
Flexibility of the hepatic zonation of carbon and nitrogen fluxes linked to lactate and pyruvate transformations in the presence of ammonia.Am J Physiol Gastrointest Liver Physiol. 2007 Oct;293(4):G838-49. doi: 10.1152/ajpgi.00120.2007. Epub 2007 Aug 9. Am J Physiol Gastrointest Liver Physiol. 2007. PMID: 17690175
-
Zonation of alanine metabolism in the bivascularly perfused rat liver.Liver Int. 2005 Aug;25(4):861-71. doi: 10.1111/j.1478-3231.2005.01093.x. Liver Int. 2005. PMID: 15998438
-
Regulation of hepatic ammonia metabolism: the intercellular glutamine cycle.Adv Enzyme Regul. 1986;25:159-80. doi: 10.1016/0065-2571(86)90013-0. Adv Enzyme Regul. 1986. PMID: 2880476
-
Hepatic glutamine metabolism.Beitr Infusionther Klin Ernahr. 1987;17:144-57. Beitr Infusionther Klin Ernahr. 1987. PMID: 2891351 Review.
-
Hepatocyte heterogeneity in the metabolism of amino acids and ammonia.Enzyme. 1992;46(1-3):72-93. doi: 10.1159/000468779. Enzyme. 1992. PMID: 1289083 Review.
Cited by
-
The Metabolic Responses to L-Glutamine of Livers from Rats with Diabetes Types 1 and 2.PLoS One. 2016 Aug 4;11(8):e0160067. doi: 10.1371/journal.pone.0160067. eCollection 2016. PLoS One. 2016. PMID: 27490892 Free PMC article.
-
Combined systems pharmacology and fecal metabonomics to study the biomarkers and therapeutic mechanism of type 2 diabetic nephropathy treated with Astragalus and Leech.RSC Adv. 2018 Aug 1;8(48):27448-27463. doi: 10.1039/c8ra04358b. eCollection 2018 Jul 30. RSC Adv. 2018. PMID: 35540008 Free PMC article.
-
Recent advances in 2D and 3D in vitro systems using primary hepatocytes, alternative hepatocyte sources and non-parenchymal liver cells and their use in investigating mechanisms of hepatotoxicity, cell signaling and ADME.Arch Toxicol. 2013 Aug;87(8):1315-530. doi: 10.1007/s00204-013-1078-5. Epub 2013 Aug 23. Arch Toxicol. 2013. PMID: 23974980 Free PMC article. Review.
-
Catabolism of amino acids in livers from cafeteria-fed rats.Mol Cell Biochem. 2013 Jan;373(1-2):265-77. doi: 10.1007/s11010-012-1499-0. Epub 2012 Nov 2. Mol Cell Biochem. 2013. PMID: 23117227
-
Effect of taurine supplementation on preventing ventilator-associated pneumonia in pediatrics under mechanical ventilation, a randomized controlled double-blind clinical trial.Front Pediatr. 2025 Jan 10;12:1490247. doi: 10.3389/fped.2024.1490247. eCollection 2024. Front Pediatr. 2025. PMID: 39867697 Free PMC article.
References
-
- Jungermann K, Katz R. In: Metabolic Compartmentation. Sies H, editor. London, Academic Press; 1982. Metabolic heterogeneity of liver parenchyma; pp. 411–435.
-
- Häussinger D, Lamers WH, Moorman AFM. Hepatocyte heterogeneity in the metabolism of amino acids and ammonia. Enzyme. 1992;46:72–93. - PubMed
Publication types
MeSH terms
Substances
LinkOut - more resources
Full Text Sources
Miscellaneous
