

Evaluation of the diagnostic performance of infrared imaging of the breast: a preliminary study
- PMID: 20055999
- PMCID: PMC2818658
- DOI: 10.1186/1475-925X-9-3
Evaluation of the diagnostic performance of infrared imaging of the breast: a preliminary study
Abstract
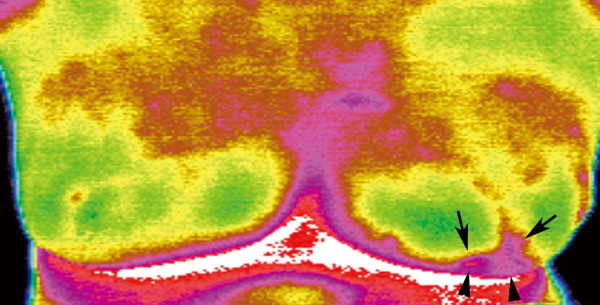
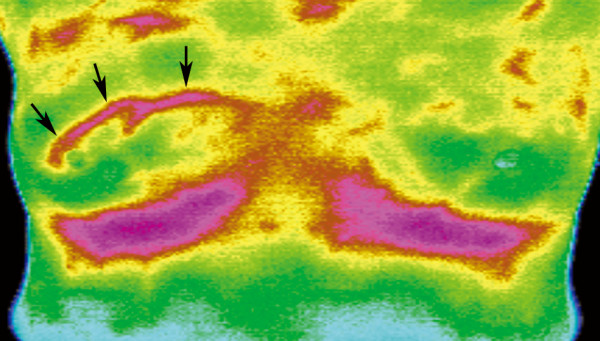
Background: The study was conducted to investigate the diagnostic performance of infrared (IR) imaging of the breast using an interpretive model derived from a scoring system.
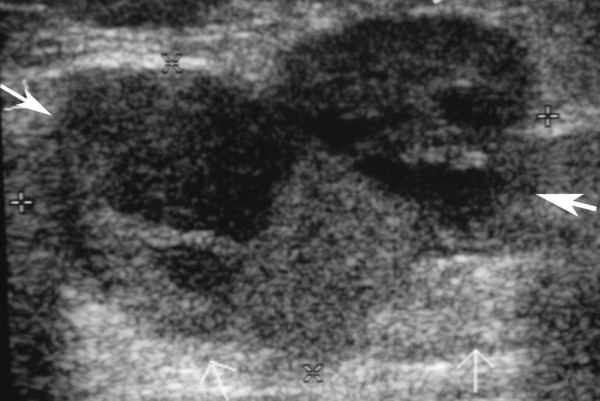
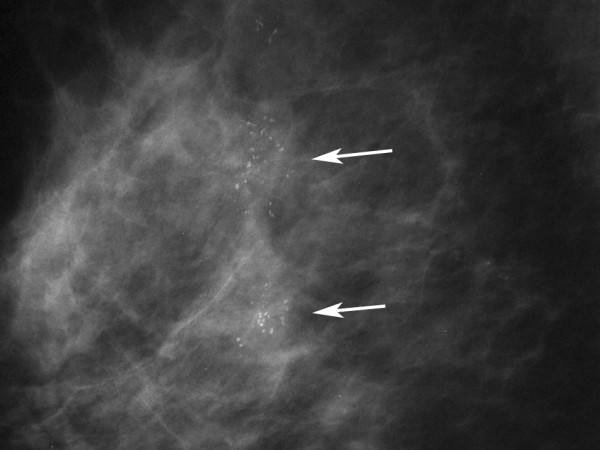
Methods: The study was approved by the Institutional Review Board of our hospital. A total of 276 women (mean age = 50.8 years, SD 11.8) with suspicious findings on mammograms or ultrasound received IR imaging of the breast before excisional biopsy. The interpreting radiologists scored the lesions using a scoring system that combines five IR signs. The ROC (receiver operating characteristic) curve and AUC (area under the ROC curve) were analyzed by the univariate logistic regression model for each IR sign and an age-adjusted multivariate logistic regression model including 5 IR signs. The cut-off values and corresponding sensitivity, specificity, Youden's Index (Index = sensitivity+specificity-1), positive predictive value (PPV), negative predictive value (NPV) were estimated from the age-adjusted multivariate model. The most optimal cut-off value was determined by the one with highest Youden's Index.
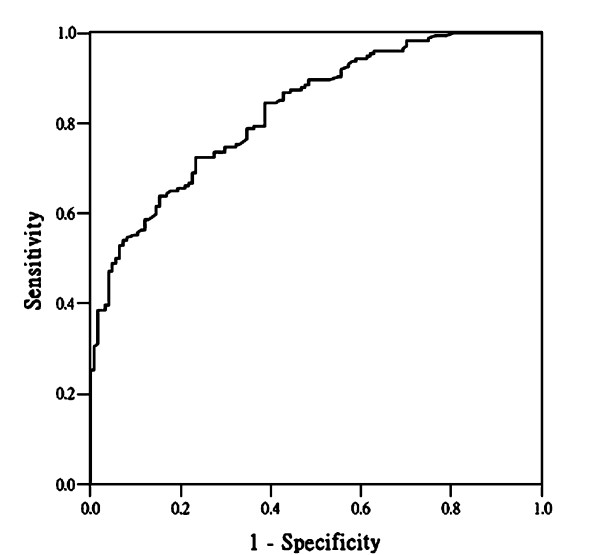
Results: For the univariate model, the AUC of the ROC curve from five IR signs ranged from 0.557 to 0.701, and the AUC of the ROC from the age-adjusted multivariate model was 0.828. From the ROC derived from the multivariate model, the sensitivity of the most optimal cut-off value would be 72.4% with the corresponding specificity 76.6% (Youden's Index = 0.49), PPV 81.3% and NPV 66.4%.
Conclusions: We established an interpretive age-adjusted multivariate model for IR imaging of the breast. The cut-off values and the corresponding sensitivity and specificity can be inferred from the model in a subpopulation for diagnostic purpose.
Trial registration: NCT00166998.
Figures
Similar articles
-
Locally advanced rectal cancer: value of ADC mapping in prediction of tumor response to radiochemotherapy.Eur J Radiol. 2013 Feb;82(2):234-40. doi: 10.1016/j.ejrad.2012.09.027. Epub 2012 Nov 1. Eur J Radiol. 2013. PMID: 23122748 Clinical Trial.
-
Computer-assisted assessment of ultrasound real-time elastography: initial experience in 145 breast lesions.Eur J Radiol. 2014 Jan;83(1):e1-7. doi: 10.1016/j.ejrad.2013.09.009. Epub 2013 Sep 23. Eur J Radiol. 2014. PMID: 24148563
-
Conventional ultrasound and contrast-enhanced ultrasound in evaluating the severity of Crohn's disease.Int J Clin Exp Med. 2015 Jan 15;8(1):123-34. eCollection 2015. Int J Clin Exp Med. 2015. PMID: 25784981 Free PMC article.
-
Breast thermography: a systematic review and meta-analysis.Syst Rev. 2024 Nov 28;13(1):295. doi: 10.1186/s13643-024-02708-9. Syst Rev. 2024. PMID: 39609910 Free PMC article.
-
Receiver Operating Characteristic (ROC) Curve Analysis for Medical Diagnostic Test Evaluation.Caspian J Intern Med. 2013 Spring;4(2):627-35. Caspian J Intern Med. 2013. PMID: 24009950 Free PMC article. Review.
Cited by
-
Evaluation of mammary cancer in 7,12-dimethylbenz(a)anthracene-induced Wister rats by asymmetrical temperature distribution analysis using thermography: a comparison with serum CEA levels and histopathology.J Biomed Biotechnol. 2012;2012:786417. doi: 10.1155/2012/786417. Epub 2012 Oct 2. J Biomed Biotechnol. 2012. PMID: 23093865 Free PMC article.
-
An automated method for the evaluation of breast cancer using infrared thermography.EXCLI J. 2018 Oct 26;17:989-998. doi: 10.17179/excli2018-1735. eCollection 2018. EXCLI J. 2018. PMID: 30564079 Free PMC article.
-
Active thermodynamic contrast imaging for label-free tumor detection in a murine xenograft tumor model.Biomed Opt Express. 2017 Oct 16;8(11):5013-5026. doi: 10.1364/BOE.8.005013. eCollection 2017 Nov 1. Biomed Opt Express. 2017. PMID: 29188098 Free PMC article.
-
The use of thermal infra-red imaging to detect delayed onset muscle soreness.J Vis Exp. 2012 Jan 22;(59):3551. doi: 10.3791/3551. J Vis Exp. 2012. PMID: 22297829 Free PMC article.
-
Infantile hemangioma status by dynamic infrared thermography: A preliminary study.Int J Dermatol. 2016 Oct;55(10):e522-32. doi: 10.1111/ijd.13298. Epub 2016 Apr 8. Int J Dermatol. 2016. PMID: 27062495 Free PMC article.
References
-
- Arena F, Barone C, Dicicco T. Proceedings of the 25th Annual International Conference of the IEEE EMBS: 17-21 September 2003; Cancun, Mexico. Edited by Engineering in Medicine and Biology Society; 2003. Use of infrared imaging in enhanced breast cancer detection and monitoring of the clinical response to treatment; pp. 1129–1132.
Publication types
MeSH terms
Associated data
LinkOut - more resources
Full Text Sources
Medical
