

Comparative analysis of missing value imputation methods to improve clustering and interpretation of microarray experiments
- PMID: 20056002
- PMCID: PMC2827407
- DOI: 10.1186/1471-2164-11-15
Comparative analysis of missing value imputation methods to improve clustering and interpretation of microarray experiments
Abstract
Background: Microarray technologies produced large amount of data. In a previous study, we have shown the interest of k-Nearest Neighbour approach for restoring the missing gene expression values, and its positive impact of the gene clustering by hierarchical algorithm. Since, numerous replacement methods have been proposed to impute missing values (MVs) for microarray data. In this study, we have evaluated twelve different usable methods, and their influence on the quality of gene clustering. Interestingly we have used several datasets, both kinetic and non kinetic experiments from yeast and human.
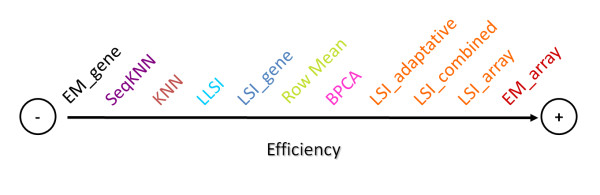
Results: We underline the excellent efficiency of approaches proposed and implemented by Bo and co-workers and especially one based on expected maximization (EM_array). These improvements have been observed also on the imputation of extreme values, the most difficult predictable values. We showed that the imputed MVs have still important effects on the stability of the gene clusters. The improvement on the clustering obtained by hierarchical clustering remains limited and, not sufficient to restore completely the correct gene associations. However, a common tendency can be found between the quality of the imputation method and the gene cluster stability. Even if the comparison between clustering algorithms is a complex task, we observed that k-means approach is more efficient to conserve gene associations.
Conclusions: More than 6.000.000 independent simulations have assessed the quality of 12 imputation methods on five very different biological datasets. Important improvements have so been done since our last study. The EM_array approach constitutes one efficient method for restoring the missing expression gene values, with a lower estimation error level. Nonetheless, the presence of MVs even at a low rate is a major factor of gene cluster instability. Our study highlights the need for a systematic assessment of imputation methods and so of dedicated benchmarks. A noticeable point is the specific influence of some biological dataset.
Figures


Similar articles
-
Influence of microarrays experiments missing values on the stability of gene groups by hierarchical clustering.BMC Bioinformatics. 2004 Aug 23;5:114. doi: 10.1186/1471-2105-5-114. BMC Bioinformatics. 2004. PMID: 15324460 Free PMC article.
-
Towards clustering of incomplete microarray data without the use of imputation.Bioinformatics. 2007 Jan 1;23(1):107-13. doi: 10.1093/bioinformatics/btl555. Epub 2006 Oct 31. Bioinformatics. 2007. PMID: 17077099
-
Collateral missing value imputation: a new robust missing value estimation algorithm for microarray data.Bioinformatics. 2005 May 15;21(10):2417-23. doi: 10.1093/bioinformatics/bti345. Epub 2005 Feb 24. Bioinformatics. 2005. PMID: 15731210
-
Clustering approaches to identifying gene expression patterns from DNA microarray data.Mol Cells. 2008 Apr 30;25(2):279-88. Epub 2008 Mar 31. Mol Cells. 2008. PMID: 18414008 Review.
-
Computational Methods for Data Integration and Imputation of Missing Values in Omics Datasets.Proteomics. 2025 Jan;25(1-2):e202400100. doi: 10.1002/pmic.202400100. Epub 2024 Dec 30. Proteomics. 2025. PMID: 39740174
Cited by
-
Trends in IT Innovation to Build a Next Generation Bioinformatics Solution to Manage and Analyse Biological Big Data Produced by NGS Technologies.Biomed Res Int. 2015;2015:904541. doi: 10.1155/2015/904541. Epub 2015 Jun 1. Biomed Res Int. 2015. PMID: 26125026 Free PMC article. Review.
-
Classifying Incomplete Gene-Expression Data: Ensemble Learning with Non-Pre-Imputation Feature Filtering and Best-First Search Technique.Int J Mol Sci. 2018 Oct 30;19(11):3398. doi: 10.3390/ijms19113398. Int J Mol Sci. 2018. PMID: 30380746 Free PMC article.
-
Latent triple trajectories of substance use as predictors for the onset of antisocial personality disorder among urban African American and Puerto Rican adults: A 22-year longitudinal study.Subst Abus. 2022;43(1):442-450. doi: 10.1080/08897077.2021.1946890. Subst Abus. 2022. PMID: 35073243 Free PMC article.
-
Shrinkage regression-based methods for microarray missing value imputation.BMC Syst Biol. 2013;7 Suppl 6(Suppl 6):S11. doi: 10.1186/1752-0509-7-S6-S11. Epub 2013 Dec 13. BMC Syst Biol. 2013. PMID: 24565159 Free PMC article.
-
Gene set enrichment analysis: performance evaluation and usage guidelines.Brief Bioinform. 2012 May;13(3):281-91. doi: 10.1093/bib/bbr049. Epub 2011 Sep 7. Brief Bioinform. 2012. PMID: 21900207 Free PMC article. Review.
References
-
- Muro S, Takemasa I, Oba S, Matoba R, Ueno N, Maruyama C, Yamashita R, Sekimoto M, Yamamoto H, Nakamori S. et al.Identification of expressed genes linked to malignancy of human colorectal carcinoma by parametric clustering of quantitative expression data. Genome Biol. 2003;4(3):R21. doi: 10.1186/gb-2003-4-3-r21. - DOI - PMC - PubMed
Publication types
MeSH terms
LinkOut - more resources
Full Text Sources
Molecular Biology Databases
