. 2010 Apr;203(2):213-9.
doi: 10.1016/j.jmr.2009.12.017. Epub 2009 Dec 24.

EPR characterization of ascorbyl and sulfur dioxide anion radicals trapped during the reaction of bovine Cytochrome c Oxidase with molecular oxygen

Affiliations

EPR characterization of ascorbyl and sulfur dioxide anion radicals trapped during the reaction of bovine Cytochrome c Oxidase with molecular oxygen

Michelle A Yu et al. J Magn Reson. 2010 Apr.

Abstract

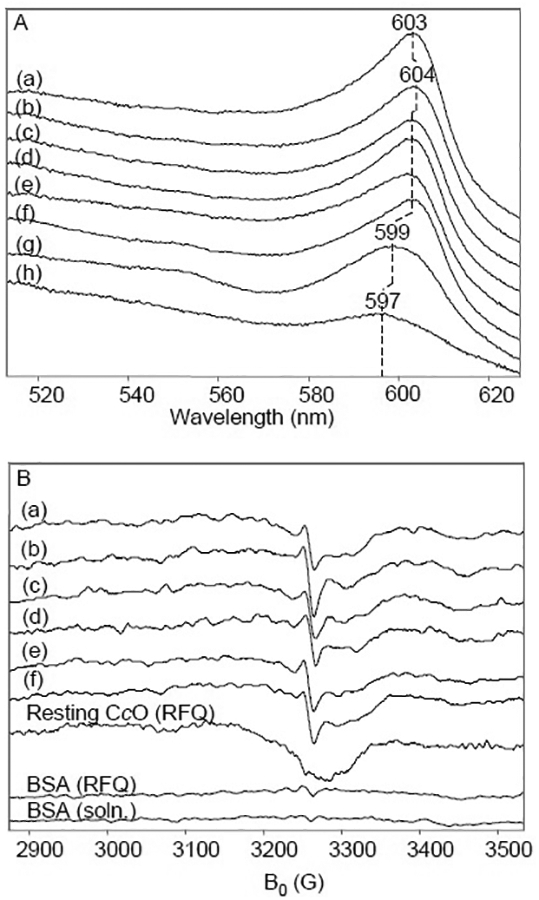
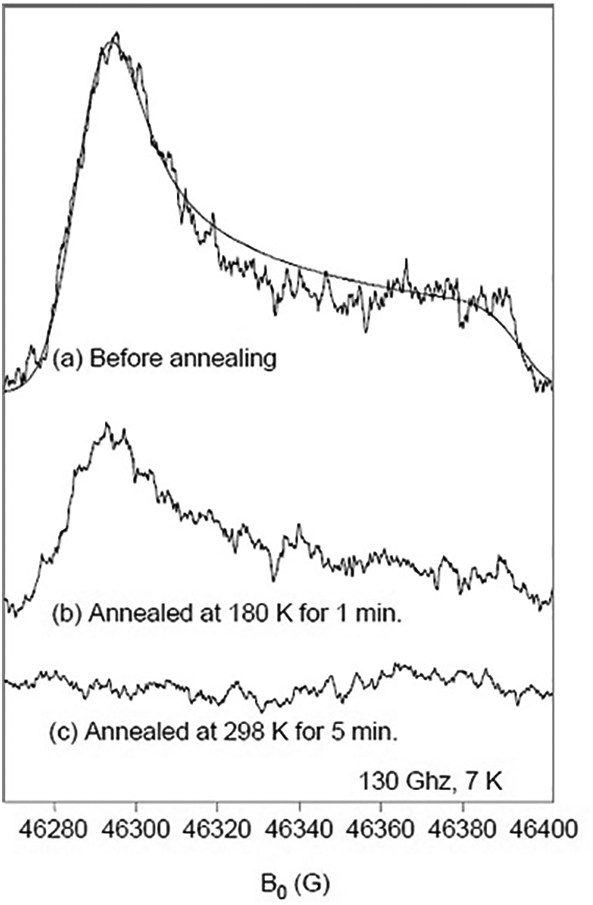
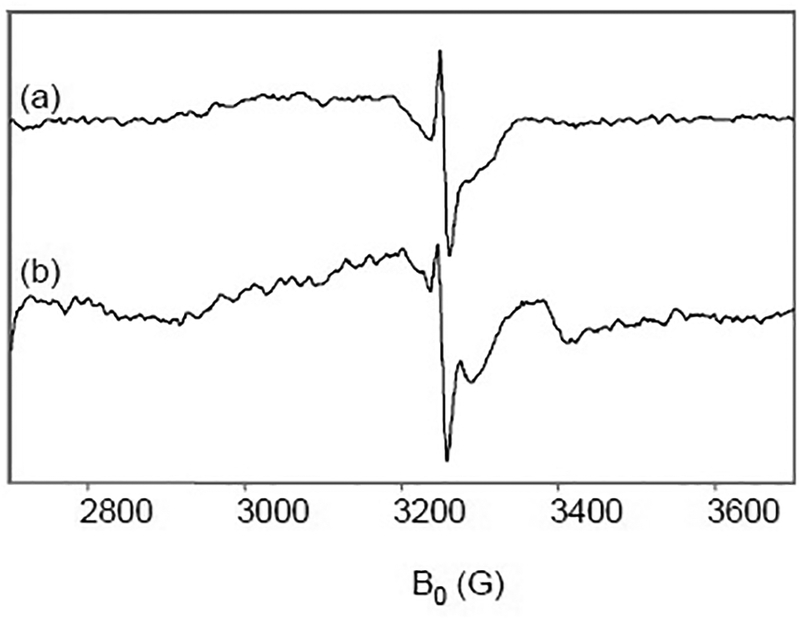
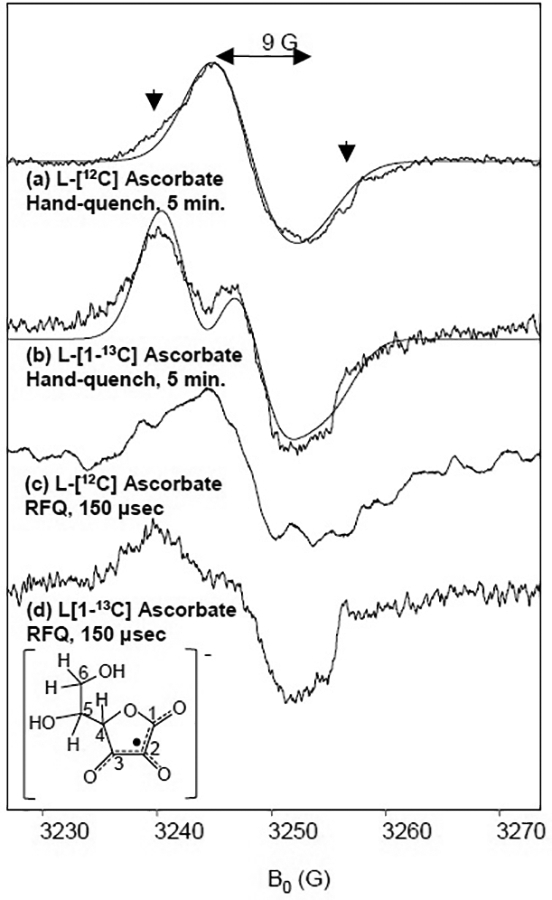
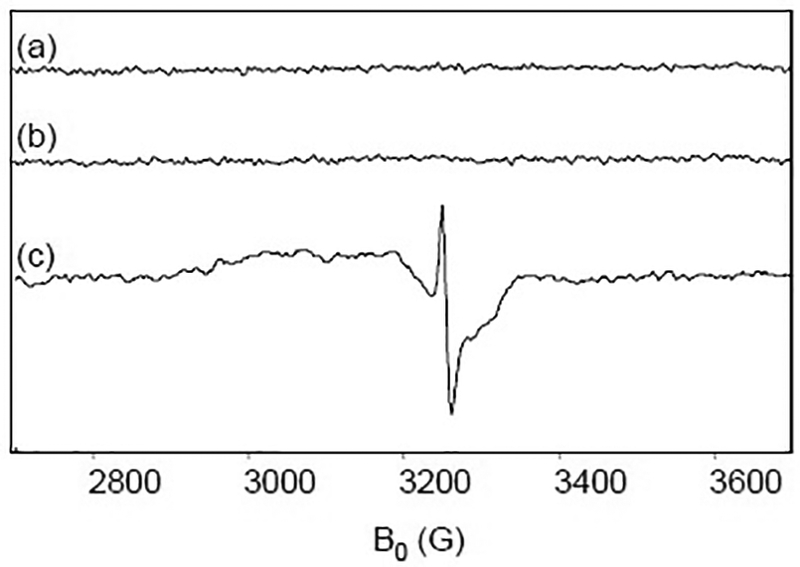
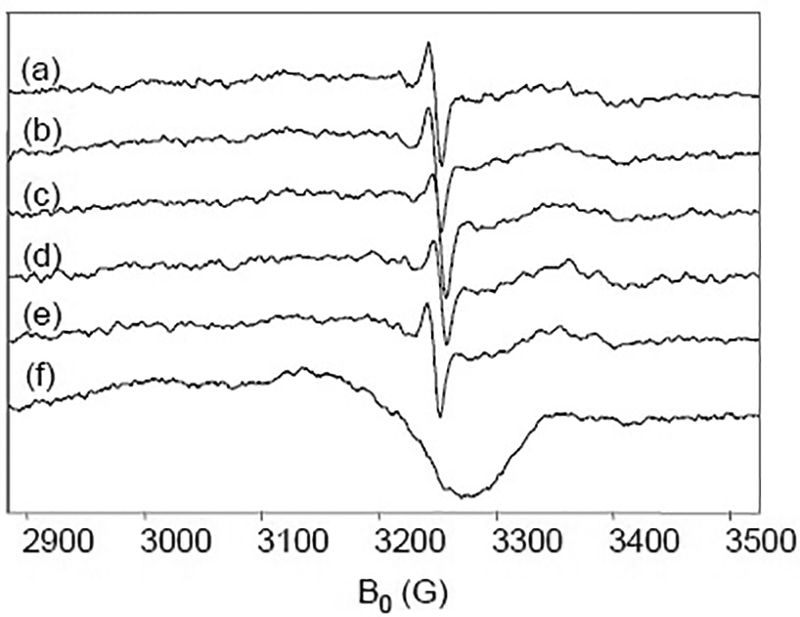
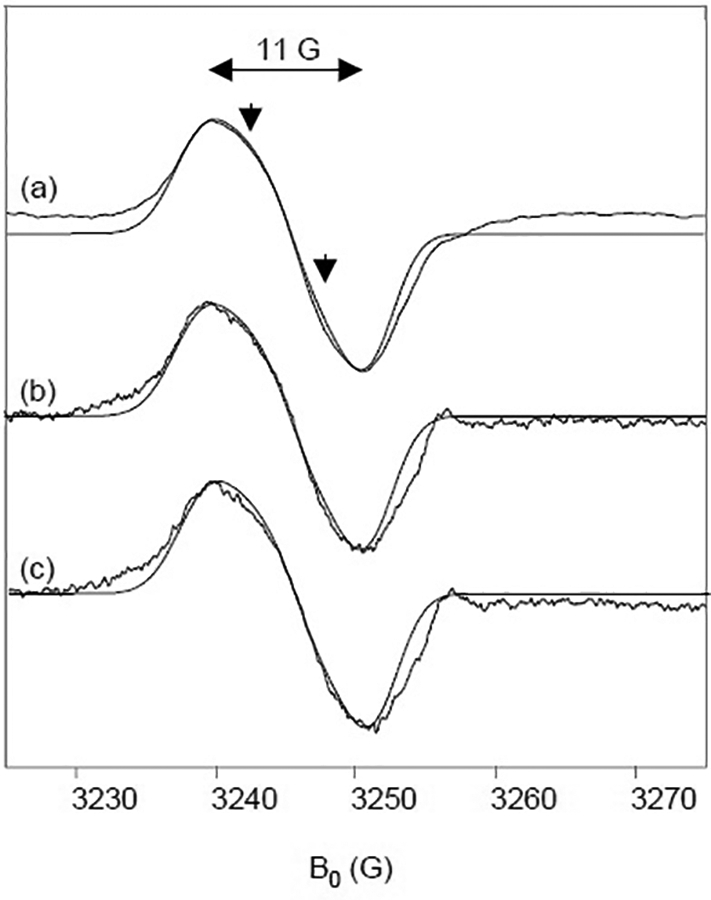
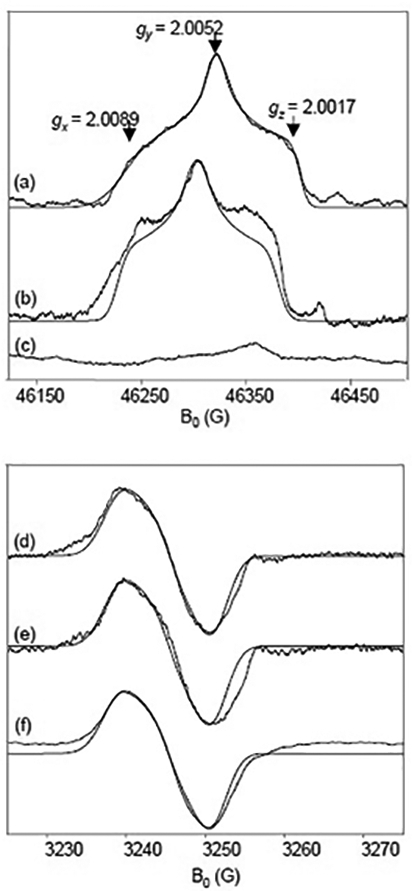
The reaction intermediates of reduced bovine Cytochrome c Oxidase (CcO) were trapped following its reaction with oxygen at 50 micros-6 ms by innovative freeze-quenching methods and studied by EPR. When the enzyme was reduced with either ascorbate or dithionite, distinct radicals were generated; X-band (9 GHz) and D-band (130 GHz) CW-EPR measurements support the assignments of these radicals to ascorbyl and sulfur dioxide anion radical (SO2(-.)), respectively. The X-band spectra show a linewidth of 12 G for the ascorbyl radical and 11 G for the SO2(-.) radical and an isotropic g-value of 2.005 for both species. The D-band spectra reveal clear distinctions in the g-tensors and powder patterns of the two species. The ascorbyl radical spectrum displays approximate axial symmetry with g-values of g(x)=2.0068, g(y)=2.0066, and g(z)=2.0023. The SO2(-.) radical has rhombic symmetry with g-values of g(x)=2.0089, g(y)=2.0052, and g(z)=2.0017. When the contributions from the ascorbyl and SO2(-.) radicals were removed, no protein-based radical on CcO could be identified in the EPR spectra.


Figures

Fig. 1
Fig. 1
Low-temperature optical absorption and X-band CW-EPR measurements of bovine CcO. A. 80 μM CcO completely reduced by 10 mM ascorbate and catalytic amounts of Cyt c under Ar then mixed with O2-saturated buffer and rapid freeze-quenched at time points (a) 50 μs, (b) 150 μs, (c) 300 μs, (d) 400 μs, (e) 540 μs, (f) 1 ms, (g) 6 ms. (h) is a sample of the resting enzyme. Optical absorption measurements were made at 83 K. Solutions were prepared in 200 mM NaPi buffer, pH 7.4, containing 0.2% w/v n-decyl-β-D-maltoside (DM). B. X-band EPR under the same conditions with quench times of (a) 50 μs, (b) 150 μs, (c) 300 μs, (d) 540 μs, (e) 1 ms, (f) 6 ms. (h) is a sample made by running resting enzyme through the RFQ device. The bottom two spectra are control samples of BSA run through the RFQ device (upper) and simply frozen in solution (lower). The conditions of EPR spectroscopy were: microwave power, 1 mW; microwave frequency, 9.1 GHz; modulation amplitude, 3.2 G; temperature 77 K.
Fig. 2
Fig. 2
D-band EPR spectra of RFQ CcO prepared with ascorbate. (a) D-band EPR measurements of 80 μM CcO, completely reduced by 10 mM ascorbate and catalytic amounts of Cyt c under Ar, then mixed with O2-saturated buffer and rapid freeze-quenched at 150 μs. A simulation with gx = 2.0068, gy = 2.0066, and gz= 2.0023 in the dotted line. Sample from (a) annealed at the conditions: (b) 180 K for 1 min and (c) 298 K for 5 min. The conditions for the D-band Hahn echo-detected spectra were: microwave frequency, 129.998 GHz; repetition rate, 50 Hz; averages per point, 100; 90 degree pulse, 50 ns; time between pulses, 130 ns; temperature, 7K.
Fig. 3
Fig. 3
X-band EPR spectra of CcO under multiple-turnover and single-turnover. (a) 150 μM CcO completely reduced by 10 mM ascorbate and catalytic amounts of Cyt c under Ar then mixed with O2-saturated buffer and hand-quenched at 5 min. (b) 150 μM CcO completely reduced by 10 mM. ascorbate and catalytic amounts of Cyt c under Ar then mixed with O2-saturated buffer and rapid freeze-quenched at 150 μs. EPR conditions as in Fig. 1.
Fig. 4
Fig. 4
X-band EPR spectra of CcO prepared with isotopically-labeled ascorbate. 150 μM CcO completely reduced by (a) 10 mM natural abundance ascorbate or (b) 10 mM L-[1-13C] ascorbate and catalytic amounts of Cyt c under Ar then mixed with O2-saturated buffer and hand-quenched at 5 min. 150 μM CcO completely reduced by (c) 10 mM natural abundance ascorbate or (d) 10 mM L-[1-13C] ascorbate and catalytic amounts of Cyt c under Ar then mixed with O2-saturated buffer and rapid freeze-quenched at 150 μs. Simulations are shown in the dotted lines with parameters shown in Table 1. EPR conditions were: frequency, 9.1 GHz; power, 0.3 mW; temperature, 77 K.
Fig. 5
Fig. 5
X-band EPR spectra of Cyt c and ascorbate. (a) 5 mM Cyt c is reduced with 5 mM ascorbate and frozen at 77 K at 5 min. (b) 0.5 mM Cyt c is reduced with 10 mM ascorbate and frozen at 77 K at 5 min. (c) 150 μM CcO and 0.5 μM Cyt c are reduced with 10 mM ascorbate and frozen at 77 K at 5 min. The pH of all samples is 7.4. EPR conditions as in Fig. 1.
Fig. 6
Fig. 6
X-band EPR spectra of CcO prepared with dithionite. 150 μM CcO completely reduced by 1.5 mM dithionite under Ar then mixed with O2-saturated buffer and rapid freeze-quenched at (a) 50, (b)150, (c) 350, (d) 450, and (e) 6000 μs. (f) 350 μs sample annealed for 1 min. at 298 K. EPR conditions as in Fig. 1.
Fig. 7
Fig. 7
X-band EPR spectra of various proteins prepared with dithionite. (a) 115 μM CcO and 50 mM Na2S2O4 rapid freeze-quenched at 50 μs. (b) 115 μM bovine serum albumin and 50 mM Na2S2O4 rapid freeze-quenched at 50 μs. X-band EPR conditions as in Fig. 1.
Fig. 8
Fig. 8
D-band (top) and X-band (bottom) EPR spectra of dithionite with and without oxygen. (a) and (d) 50 mM Na2S2O4 in degassed buffer rapid freeze-quenched at 50 μs. (b) and (e) 50 mM Na2S2O4 with oxygenated buffer and 115 μM CcO rapid freeze-quenched at 50 μs. (c) Sample from (b) annealed at 180 K for 1 min. (f) 50 mM Na2S2O4 in oxygenated buffer rapid freeze-quenched at 50 μs. D-band and X-band EPR conditions as in Figs. 2 and 1, respectively.

Similar articles

Cited by

References

    1. Buckel W and Golding BT, Radical enzymes in anaerobes, Annu Rev Microbiol 60 (2006) 27–49. - PubMed
    1. Marsh EN, A radical approach to enzyme catalysis, Bioessays 17 (1995) 431–41. - PubMed
    1. Stubbe J and van Der Donk WA, Protein Radicals in Enzyme Catalysis, Chem Rev 98 (1998) 705–762. - PubMed
    1. Sjoberg BM, Reichard P, Graslund A and Ehrenberg A, The tyrosine free radical in ribonucleotide reductase from Escherichia coli, J Biol Chem 253 (1978) 6863–5. - PubMed
    1. Licht S, Gerfen GJ and Stubbe J, Thiyl radicals in ribonucleotide reductases, Science 271 (1996) 477–81. - PubMed

Publication types

LinkOut - more resources