

Economic activity and trends in ambient air pollution
- PMID: 20056563
- PMCID: PMC2866675
- DOI: 10.1289/ehp.0901145
Economic activity and trends in ambient air pollution
Abstract
Background: One challenge in assessing the health effects of human exposure to air pollution in epidemiologic studies is the lack of widespread historical air pollutant monitoring data with which to characterize past exposure levels.
Objectives: Given the availability of long-term economic data, we relate economic activity levels to patterns in vehicle-related particulate matter (PM) over a 30-year period in New Jersey, USA, to provide insight into potential historical surrogate markers of air pollution.
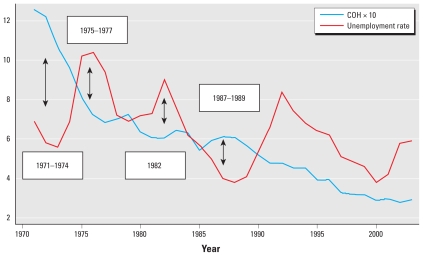
Methods: We used statewide unemployment and county-level trucking industry characteristics to estimate historical coefficient of haze (COH), a marker of vehicle-related PM predominantly from diesel exhaust. A total of 5,920 observations were included across 25 different locations in New Jersey between 1971 and 2003.
Results: A mixed-modeling approach was employed to estimate the impact of economic indicators on measured COH. The model explained approximately 50% of the variability in COH as estimated by the overall R2 value. Peaks and lows in unemployment tracked negatively with similar extremes in COH, whereas employment in the trucking industry was positively associated with COH. Federal air quality regulations also played a large and significant role in reducing COH levels over the study period.
Conclusions: This new approach outlines an alternative method to reconstruct historical exposures that may greatly aid epidemiologic research on specific causes of health effects from urban air pollution. Economic activity data provide a potential surrogate marker of changes in exposure levels over time in the absence of direct monitoring data for chronic disease studies, but more research in this area is needed.
Figures


Similar articles
-
Personal and ambient exposures to air toxics in Camden, New Jersey.Res Rep Health Eff Inst. 2011 Aug;(160):3-127; discussion 129-51. Res Rep Health Eff Inst. 2011. PMID: 22097188
-
The London low emission zone baseline study.Res Rep Health Eff Inst. 2011 Nov;(163):3-79. Res Rep Health Eff Inst. 2011. PMID: 22315924
-
Evaluating heterogeneity in indoor and outdoor air pollution using land-use regression and constrained factor analysis.Res Rep Health Eff Inst. 2010 Dec;(152):5-80; discussion 81-91. Res Rep Health Eff Inst. 2010. PMID: 21409949
-
Air Pollution, Disease Burden, and Health Economic Loss in China.Adv Exp Med Biol. 2017;1017:233-242. doi: 10.1007/978-981-10-5657-4_10. Adv Exp Med Biol. 2017. PMID: 29177965 Review.
-
Assessing Adverse Health Effects of Long-Term Exposure to Low Levels of Ambient Air Pollution: Implementation of Causal Inference Methods.Res Rep Health Eff Inst. 2022 Jan;2022(211):1-56. Res Rep Health Eff Inst. 2022. PMID: 36193708 Free PMC article. Review.
Cited by
-
Recessions and health: the impact of economic trends on air pollution in California.Am J Public Health. 2012 Oct;102(10):1951-6. doi: 10.2105/AJPH.2012.300658. Epub 2012 Aug 16. Am J Public Health. 2012. PMID: 22897522 Free PMC article.
-
Do temporal trends of associations between short-term exposure to fine particulate matter (PM2.5) and risk of hospitalizations differ by sub-populations and urbanicity-a study of 968 U.S. counties and the Medicare population.Environ Res. 2022 Apr 15;206:112271. doi: 10.1016/j.envres.2021.112271. Epub 2021 Oct 25. Environ Res. 2022. PMID: 34710436 Free PMC article.
-
Individual joblessness, contextual unemployment, and mortality risk.Am J Epidemiol. 2014 Aug 1;180(3):280-7. doi: 10.1093/aje/kwu128. Epub 2014 Jul 3. Am J Epidemiol. 2014. PMID: 24993734 Free PMC article.
-
Mortality differences between migrants and Italians residing in Rome before, during, and in the aftermath of the great recession. A longitudinal cohort study from 2001 to 2015.BMC Public Health. 2021 Nov 17;21(1):2112. doi: 10.1186/s12889-021-12176-8. BMC Public Health. 2021. PMID: 34789200 Free PMC article.
-
A retrospective assessment of occupational exposure to elemental carbon in the U.S. trucking industry.Environ Health Perspect. 2011 Jul;119(7):997-1002. doi: 10.1289/ehp.1002981. Epub 2011 Mar 29. Environ Health Perspect. 2011. PMID: 21447452 Free PMC article.
References
-
- Allen GA, Lawrence J, Koutrakis P. Field validation of a semi-continuous method for aerosol black carbon (aethalometer) and temporal patterns of summertime hourly black carbon measurements. Atmos Environ. 1999;33(5):817–823.
-
- Baltagi BH, Wu PX. Unequally spaced panel data regressions with AR(1) disturbances. Econom Theory. 1999;15(6):814–823.
-
- Brenner MH. Mental Illness and the Economy. Cambridge, MA: Harvard University Press; 1973.
Publication types
MeSH terms
Substances
Grants and funding
LinkOut - more resources
Full Text Sources
Medical
Miscellaneous
