

National use of asbestos in relation to economic development
- PMID: 20056590
- PMCID: PMC2831954
- DOI: 10.1289/ehp.0901196
National use of asbestos in relation to economic development
Abstract
Background: National disparities in asbestos use will likely lead to an unequal burden of asbestos diseases.
Objectives: As economic status may be linked to asbestos use, we assessed, globally, the relationship between indicators of national economic development and asbestos use.
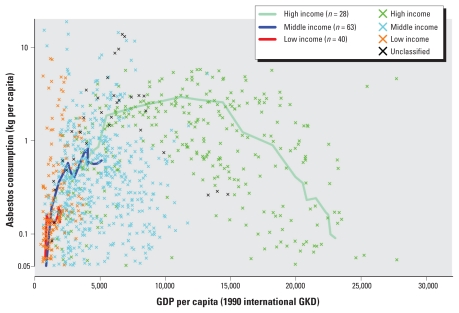
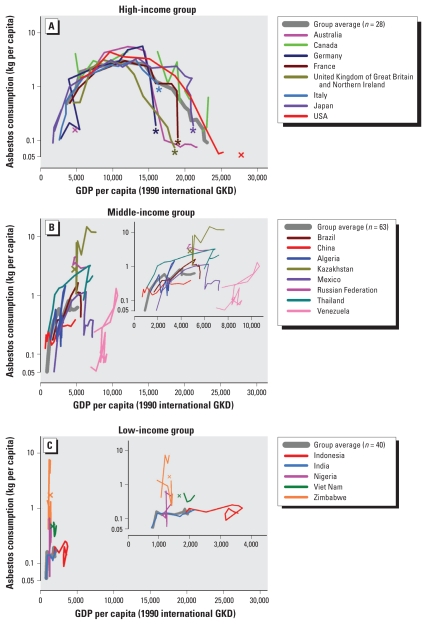
Methods: For the 135 countries that have ever used asbestos, per capita asbestos use (kilograms per capita per year) was compared with per capita gross domestic product (GDP) in 1990 Geary-Khamis dollars (GKD) for the period 1920-2003. Countries were grouped into three income levels (high, middle, and low) that were adapted from the 2003 World Bank categories.
Results: The historical pattern of asbestos use followed the environmental Kuznets curve in which use by high-income countries peaked when incomes attained 10,000-15,000 GKD and essentially ceased at income levels over 20,000 GKD. Currently, middle- and low-income countries are increasing their use of asbestos, closely following the paths once traced by higher income countries.
Conclusions: Developing countries have the opportunity to eliminate asbestos use sooner than high-income countries and thus reduce the future burden of asbestos diseases.
Figures
Similar articles
-
Trends and the Economic Effect of Asbestos Bans and Decline in Asbestos Consumption and Production Worldwide.Int J Environ Res Public Health. 2018 Mar 16;15(3):531. doi: 10.3390/ijerph15030531. Int J Environ Res Public Health. 2018. PMID: 29547510 Free PMC article.
-
Development of the "National Asbestos Profile" to Eliminate Asbestos-Related Diseases in 195 Countries.Int J Environ Res Public Health. 2021 Feb 12;18(4):1804. doi: 10.3390/ijerph18041804. Int J Environ Res Public Health. 2021. PMID: 33673264 Free PMC article.
-
Income Inequality, Economic Growth and Stroke Mortality in Brazil: Longitudinal and Regional Analysis 2002-2009.PLoS One. 2015 Sep 9;10(9):e0137332. doi: 10.1371/journal.pone.0137332. eCollection 2015. PLoS One. 2015. PMID: 26352415 Free PMC article.
-
Socioeconomic Relation with Plastic Consumption on 61 Countries Classified by Continent, Income Status and Coastal Regions.Bull Environ Contam Toxicol. 2021 Oct;107(4):786-792. doi: 10.1007/s00128-021-03231-6. Epub 2021 Apr 15. Bull Environ Contam Toxicol. 2021. PMID: 33860344
-
Global Asbestos Disaster.Int J Environ Res Public Health. 2018 May 16;15(5):1000. doi: 10.3390/ijerph15051000. Int J Environ Res Public Health. 2018. PMID: 29772681 Free PMC article. Review.
Cited by
-
Follow-up of Soluble Mesothelin-Related Protein Levels in Participants With Asbestos-Related Disorders.Saf Health Work. 2020 Dec;11(4):425-430. doi: 10.1016/j.shaw.2020.07.009. Epub 2020 Aug 3. Saf Health Work. 2020. PMID: 33329908 Free PMC article.
-
Elimination of asbestos use and asbestos-related diseases: an unfinished story.Cancer Sci. 2012 Oct;103(10):1751-5. doi: 10.1111/j.1349-7006.2012.02366.x. Epub 2012 Aug 1. Cancer Sci. 2012. PMID: 22726320 Free PMC article. Review.
-
Barriers and Facilitators to the Elimination of Asbestos Related Diseases-Stakeholders' Perspectives.Int J Environ Res Public Health. 2017 Oct 22;14(10):1269. doi: 10.3390/ijerph14101269. Int J Environ Res Public Health. 2017. PMID: 29065497 Free PMC article.
-
Trends and the Economic Effect of Asbestos Bans and Decline in Asbestos Consumption and Production Worldwide.Int J Environ Res Public Health. 2018 Mar 16;15(3):531. doi: 10.3390/ijerph15030531. Int J Environ Res Public Health. 2018. PMID: 29547510 Free PMC article.
-
Cell-growth and migration inhibition of human mesothelioma cells induced by 3-O-methylfunicone from Penicillium pinophilum and cisplatin.Invest New Drugs. 2012 Aug;30(4):1343-51. doi: 10.1007/s10637-011-9698-1. Epub 2011 Jun 9. Invest New Drugs. 2012. PMID: 21656164
References
-
- Andreoni J, Levinson A. The simple analytics of the environmental Kuznets curve. J Public Econ. 2001;80:269–286.
-
- Antao VC, Pinheiro GA, Wassell JT. Asbestosis mortality in the USA: facts and predictions. Occup Environ Med. 2009;66:335–338. - PubMed
-
- Concha–Barrientos M, Nelson DI, Driscoll T, Steenland NK, Punnett L, Fingerhut MA, et al. Comparative Quantification of Health Risks: Global and Regional Burden of Diseases Attributable to Selected Major Risk Factors. Geneva: World Health Organization; 2004. Selected occupational risk factors; pp. 1651–1801.
-
- Driscoll T, Nelson DI, Steenland K, Leigh J, Concha–Barrientos M, Fingerhut M, et al. The global burden of disease due to occupational carcinogens. Am J Ind Med. 2005a;48:419–431. - PubMed
-
- Driscoll T, Nelson DI, Steenland K, Leigh J, Concha–Barrientos M, Fingerhut M, et al. The global burden of non–malignant respiratory disease due to occupational airborne exposures. Am J Ind Med. 2005b;48:432–445. - PubMed
Publication types
MeSH terms
Substances
LinkOut - more resources
Full Text Sources
Medical
Research Materials
