Non-peptidic thrombospondin-1 mimics as fibroblast growth factor-2 inhibitors: an integrated strategy for the development of new antiangiogenic compounds
- PMID: 20056600
- PMCID: PMC2838296
- DOI: 10.1074/jbc.M109.085605
Non-peptidic thrombospondin-1 mimics as fibroblast growth factor-2 inhibitors: an integrated strategy for the development of new antiangiogenic compounds
Abstract
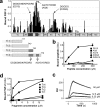
Endogenous inhibitors of angiogenesis, such as thrombospondin-1 (TSP-1), are promising sources of therapeutic agents to treat angiogenesis-driven diseases, including cancer. TSP-1 regulates angiogenesis through different mechanisms, including binding and sequestration of the angiogenic factor fibroblast growth factor-2 (FGF-2), through a site located in the calcium binding type III repeats. We hypothesized that the FGF-2 binding sequence of TSP-1 might serve as a template for the development of inhibitors of angiogenesis. Using a peptide array approach followed by binding assays with synthetic peptides and recombinant proteins, we identified a FGF-2 binding sequence of TSP-1 in the 15-mer sequence DDDDDNDKIPDDRDN. Molecular dynamics simulations, taking the full flexibility of the ligand and receptor into account, and nuclear magnetic resonance identified the relevant residues and conformational determinants for the peptide-FGF interaction. This information was translated into a pharmacophore model used to screen the NCI2003 small molecule databases, leading to the identification of three small molecules that bound FGF-2 with affinity in the submicromolar range. The lead compounds inhibited FGF-2-induced endothelial cell proliferation in vitro and affected angiogenesis induced by FGF-2 in the chicken chorioallantoic membrane assay. These small molecules, therefore, represent promising leads for the development of antiangiogenic agents. Altogether, this study demonstrates that new biological insights obtained by integrated multidisciplinary approaches can be used to develop small molecule mimics of endogenous proteins as therapeutic agents.
Figures


Similar articles
-
Targeting tumor angiogenesis with TSP-1-based compounds: rational design of antiangiogenic mimetics of endogenous inhibitors.Oncotarget. 2010 Nov;1(7):662-673. doi: 10.18632/oncotarget.200. Oncotarget. 2010. PMID: 21317461 Free PMC article. Review.
-
Fibroblast growth factor-2 binding to the thrombospondin-1 type III repeats, a novel antiangiogenic domain.Int J Biochem Cell Biol. 2008;40(4):700-9. doi: 10.1016/j.biocel.2007.10.002. Epub 2007 Oct 9. Int J Biochem Cell Biol. 2008. PMID: 17996481 Free PMC article.
-
Inhibition of angiogenesis by thrombospondin-1 is mediated by 2 independent regions within the type 1 repeats.Circulation. 1999 Sep 28;100(13):1423-31. doi: 10.1161/01.cir.100.13.1423. Circulation. 1999. PMID: 10500044
-
Thrombospondin 1 as a scavenger for matrix-associated fibroblast growth factor 2.Blood. 2003 Dec 15;102(13):4399-406. doi: 10.1182/blood-2003-03-0893. Epub 2003 Aug 28. Blood. 2003. PMID: 12947001
-
Fibroblast growth factor-2 antagonist and antiangiogenic activity of long-pentraxin 3-derived synthetic peptides.Curr Pharm Des. 2009;15(30):3577-89. doi: 10.2174/138161209789206962. Curr Pharm Des. 2009. PMID: 19860702 Review.
Cited by
-
Applications of surface plasmon resonance (SPR) for the characterization of nanoparticles developed for biomedical purposes.Sensors (Basel). 2012 Nov 27;12(12):16420-32. doi: 10.3390/s121216420. Sensors (Basel). 2012. PMID: 23443386 Free PMC article.
-
Advances in Anti-metabolic Disease Treatments Targeting CD47.Curr Pharm Des. 2022;28(46):3720-3728. doi: 10.2174/1381612828666221006123144. Curr Pharm Des. 2022. PMID: 36201266 Review.
-
The thrombospondins.Cold Spring Harb Perspect Biol. 2011 Oct 1;3(10):a009712. doi: 10.1101/cshperspect.a009712. Cold Spring Harb Perspect Biol. 2011. PMID: 21875984 Free PMC article. Review.
-
Heparin Binding Proteins as Therapeutic Target: An Historical Account and Current Trends.Medicines (Basel). 2019 Jul 29;6(3):80. doi: 10.3390/medicines6030080. Medicines (Basel). 2019. PMID: 31362364 Free PMC article. Review.
-
Targeting tumor angiogenesis with TSP-1-based compounds: rational design of antiangiogenic mimetics of endogenous inhibitors.Oncotarget. 2010 Nov;1(7):662-673. doi: 10.18632/oncotarget.200. Oncotarget. 2010. PMID: 21317461 Free PMC article. Review.
References
Publication types
MeSH terms
Substances
Grants and funding
LinkOut - more resources
Full Text Sources
Other Literature Sources
Miscellaneous

