. 2010 Mar 5;285(10):7838-45.
doi: 10.1074/jbc.M109.065367. Epub 2010 Jan 7.

Expression and function of epithelial anoctamins

Affiliations

Expression and function of epithelial anoctamins

Rainer Schreiber et al. J Biol Chem. .

Abstract

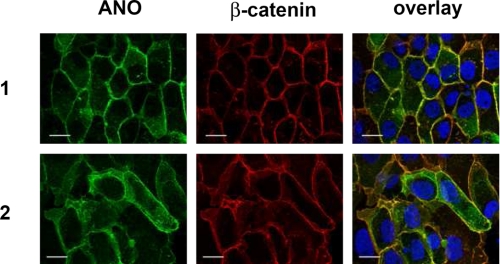
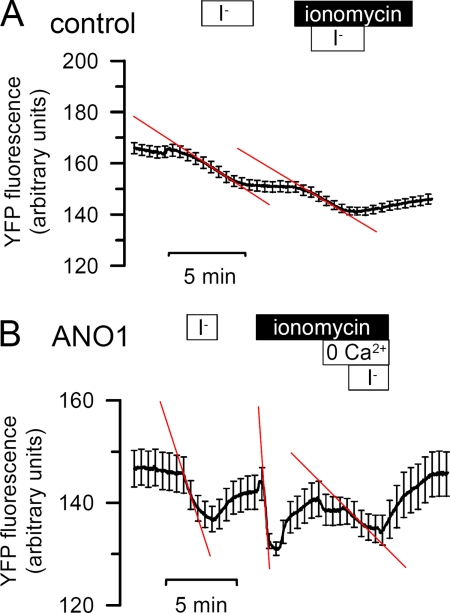
The calcium-activated chloride channel anoctamin1 (ANO1; TMEM16A) is fundamental for the function of epithelial organs. Mice lacking ANO1 expression exhibit transport defects and a pathology similar to cystic fibrosis. They also show a general defect of epithelial electrolyte transport. Here we analyzed expression of all ten members (ANO1-ANO10) in a broad range of murine tissues and detected predominant expression of ANO1, 6, 7, 8, 9, 10 in epithelial tissues, while ANO2, 3, 4, 5 are common in neuronal and muscle tissues. When expressed in Fisher Rat Thyroid (FTR) cells, all ANO proteins localized to the plasma membrane but only ANO1, 2, 6, and 7 produced Ca(2+)-activated Cl(-) conductance, as analyzed by ATP-induced iodide quenching of YFP fluorescence. In contrast ANO9 and ANO10 suppressed baseline Cl(-) conductance and coexpression of ANO9 with ANO1 inhibited ANO1 activity. Patch clamping of ANO-expressing FRT cells indicated that apart from ANO1 also ANO6 and 10 produced chloride currents, albeit with very different Ca(2+) sensitivity and activation time. We conclude that each tissue expresses a set of anoctamins that form cell- and tissue-specific Ca(2+)-dependent Cl(-) channels.


Figures

FIGURE 1.
FIGURE 1.
Expression of ANO proteins in murine tissues. Real-time RT-PCR was performed from total RNA of different mouse tissues. Expression of mRNA for ANO1–10 was normalized using expression of β-actin as a reference (relative expression). A mean value for expression was calculated from three mice and at least one PCR run per tissue.
FIGURE 2.
FIGURE 2.
Expression of ANO proteins in FRT cells. A, total RNA was isolated from Fisher rat thyroid (FRT) cells and RT-PCR was performed to identify endogenous expression of ANO proteins. FRT cells expressed mRNA for ANO6, ANO8, and ANO10, whereas no detectable signal was found for ANO1, ANO2, ANO3, ANO4, ANO5, ANO7, and ANO9. ± indicates presence or absence of reverse transcriptase. B, overexpression of His-tagged human anoctamins in FRT cells as detected by Western blotting using a His antibody. Actin indicates equal loading.
FIGURE 3.
FIGURE 3.
ANO1 and ANO2 are associated with the plasma membrane of FRT cells. His-tagged ANO1 and ANO2 were overexpressed in FRT cells and were detected with anti-His antibody. β-Catenin was visualized using an Alexa 568-labeled phalloidin. Plasma membrane staining of ANO1 and ANO2 is shown by colocalization with β-catenin (yellow color in the overlay picture). No immunofluorescence was detected in mock-transfected control cells.
FIGURE 4.
FIGURE 4.
Purinergic activation of ANO1 in FRT cells. Original traces of mock- (A) and ANO1- (B) transfected FRT cells. Activation of Ca2+-activated chloride channels was measured by I influx measurements using the I-sensitive protein YFP-I152L. Initial slopes of YFP fluorescence quenching by I influx (red lines) correlates to the size of the chloride conductance. ANO1 expression increased baseline I uptake, which was further accelerated by purinergic stimulation (A = 100 μm ATP). Elevation of cAMP by IBMX (100 μm) and forskolin (2 μm, IBMX/Fors) had no effects on I influx.
FIGURE 5.
FIGURE 5.
ATP- but not cAMP-activated ANO family members in FRT cells. Summarized effects of purinergic and cAMP stimulation on I uptake in ANO-overexpressing FRT cells. Basal I uptake (basal) was increased by ANO1 expression in FRT cells. ANO1, ANO2, ANO6, and ANO7 (L and S) were activated by purinergic stimulation (ATP, 100 μm), therefore cAMP elevation by IBMX (100 μm) and forskolin (2 μm) had no further effects on basal activity of Ca2+-activated Cl channels. Values are mean ± S.E. (#, paired t test to basal activity, p < 0.05; §, ANOVA to control, p < 0.05; n = number of cells).
FIGURE 6.
FIGURE 6.
Activation of ANO1 by ionomycin is Ca2+ dependent. Original traces of mock (A) and ANO1 (B)-transfected FRT cells. Treatment of FRT cells with ionomycin (1 μm)-activated I uptake, which was clearly reduced by removal of Ca2+ from the extracellular bath solution (0 Ca2+).
FIGURE 7.
FIGURE 7.
Ionomycin-activated ANO1 in FRT cells. Summary of the effects of ionomycin (1 μm) on I uptake in FRT cells overexpressing anoctamins. Basal I uptake (basal) in FRT cells was increased by expression of ANO1. I uptake was activated by ionomycin (1 μm) in cells expressing ANO1, but not in cells expressing other anoctamin proteins. Values are mean ± S.E. (#, paired t test to basal activity, p < 0.05; §, ANOVA to control, p < 0.05; n, number of cells).
FIGURE 8.
FIGURE 8.
Activity of ANO1 is inhibited by coexpression of ANO9. Basal (basal) and ATP (100 μm) activated I uptake in ANO1-expressing FRT cells was reduced in the presence of coexpressed ANO9 and was slightly reduced after coexpression of ANO10. Treatment with IBMX (100 μm) and forskolin (2 μm) (I/F) had no effects on I uptake. Note that also basal I uptake is inhibited by ANO9. Values are mean ± S.E. (#, paired t test to basal activity, p < 0.05; §, ANOVA to control, p < 0.05; n, number of cells).
FIGURE 9.
FIGURE 9.
Anoctamins form Ca2+-dependent Cl currents with different properties. A, original continuous recording of the whole-cell current measured in mock-transfected FRT cells expressing endogenous anoctamins only (left trace) or overexpressing ANO1 (right trace). Stimulation with ATP (100 μm)-induced slow activation of endogenous Cl currents in mock-transfected cells, but fast activation of whole-cell Cl currents in ANO1-expressing cells. B, summary of the whole-cell conductances activated by ATP in mock-transfected and ANO1-overexpressing cells. Whereas both endogenous and ANO1-related currents were inhibited by replacement of extracellular Cl with gluconate, only ANO1 currents demonstrated a higher conductance in the presence of iodide. C, continuous recording of the whole-cell current after establishing whole-cell configuration (arrow and line). Patch pipettes were filled with a solution containing 1 μm Ca2+. Whereas whole-cell currents were quickly activated in ANO1-expressing cells, ANO10-expressing or mock-transfected cells only slowly activated a whole-cell current. Niflumic acid (F; 100 μm) potently inhibited ANO1 currents but had little effects of ANO10 and endogenous currents. Values are mean ± S.E. (*, significant effect of iodide and gluconate, paired-test); n, number of cells.
FIGURE 10.
FIGURE 10.
ANO1 produces large and rapidly activating Ca2+-dependent Cl currents. A, Ca2+ sensitivity of different anoctamins and endogenous currents (mock). ANO1 required 10 μm of cytosolic Ca2+ for full activation but was inhibited at higher Ca2+ concentrations. B, summary of the time course for activation of the different anoctamins and endogenous currents (mock). 80% of the ANO1 current is activated after 20 s, while 80% activation of the other anoctamins requires 6 min. C, I/V curves of whole-cell currents in ANO1-expressing FRT cells, measured 30 s after establishing a whole-cell configuration. Activation of ANO1 currents is reduced in the presence of siRNA for ANO10 (si-16K). D, concentration-dependent inhibition of whole-cell currents by NFA in ANO1 and ANO 10-expressing cells. Values are mean ± S.E. (*, significant effect of iodide and gluconate, paired-test); n, number of cells.

Similar articles

Cited by

References

    1. Hartzell C., Putzier I., Arreola J. (2005) Annu. Rev. Physiol 67, 719–758 - PubMed
    1. Leblanc N., Ledoux J., Saleh S., Sanguinetti A., Angermann J., O'Driscoll K., Britton F., Perrino B. A., Greenwood I. A. (2005) Can. J. Physiol. Pharmacol. 83, 541–556 - PubMed
    1. Frings S., Reuter D., Kleene S. J. (2000) Prog. Neurobiol. 60, 247–289 - PubMed
    1. Eggermont J. (2004) Proc. Am. Thorac. Soc. 1, 22–27 - PubMed
    1. Kidd J. F., Thorn P. (2000) Annu. Rev. Physiol. 62, 493–513 - PubMed

Publication types

MeSH terms