. 2010 Mar 5;285(10):7566-74.
doi: 10.1074/jbc.M109.063693. Epub 2010 Jan 7.

P2X4 activation modulates volume-sensitive outwardly rectifying chloride channels in rat hepatoma cells

Affiliations

P2X4 activation modulates volume-sensitive outwardly rectifying chloride channels in rat hepatoma cells

Diego Varela et al. J Biol Chem. .

Abstract

Volume-sensitive outwardly rectifying (VSOR) Cl(-) channels are critical for the regulatory volume decrease (RVD) response triggered upon cell swelling. Recent evidence indicates that H(2)O(2) plays an essential role in the activation of these channels and that H(2)O(2) per se activates the channels under isotonic isovolumic conditions. However, a significant difference in the time course for current onset between H(2)O(2)-induced and hypotonicity-mediated VSOR Cl(-) activation is observed. In several cell types, cell swelling induced by hypotonic challenges triggers the release of ATP to the extracellular medium, which in turn, activates purinergic receptors and modulates cell volume regulation. In this study, we have addressed the effect of purinergic receptor activation on H(2)O(2)-induced and hypotonicity-mediated VSOR Cl(-) current activation. Here we show that rat hepatoma cells (HTC) exposed to a 33% hypotonic solution responded by rapidly activating VSOR Cl(-) current and releasing ATP to the extracellular medium. In contrast, cells exposed to 200 microm H(2)O(2) VSOR Cl(-) current onset was significantly slower, and ATP release was not detected. In cells exposed to either 11% hypotonicity or 200 microm H(2)O(2), exogenous addition of ATP in the presence of extracellular Ca(2+) resulted in a decrease in the half-time for VSOR Cl(-) current onset. Conversely, in cells that overexpress a dominant-negative mutant of the ionotropic receptor P2X4 challenged with a 33% hypotonic solution, the half-time for VSOR Cl(-) current onset was significantly slowed down. Our results indicate that, at high hypotonic imbalances, swelling-induced ATP release activates the purinergic receptor P2X4, which in turn modulates the time course of VSOR Cl(-) current onset in a extracellular Ca(2+)-dependent manner.


Figures

FIGURE 1.
FIGURE 1.
Hypotonicity- and H2O2-evoked VSOR Cl currents. Representative current traces of nystatin-perforated whole-cell currents activated by a voltage step protocol (2000 ms) from a holding potential of −30 mV ranging from −100 to 100 mV in 20 mV steps. The test pulse was preceded by a pulse to −100 mV (200 ms) and followed by a pulse to −60 mV (200 ms), for cells exposed to 33% hypotonic solution (A) or 200 μm H2O2 (B). C, representative experiment showing the time course of VSOR Cl current development evoked by exposure to 33% hypotonicity (○) or 200 μm H2O2 in isotonicity (▵) in the presence of 2 mm external Ca2+. Currents were measured at 80 mV every 7 s and normalized to cell capacitance.
FIGURE 2.
FIGURE 2.
Effect of external Ca2+ removal on VSOR Cl currents and Cao2+ changes. Representative experiments of the time course of VSOR Cl current development evoked by exposure to 33% hypotonicity (A) or by 200 μm H2O2 (B) in a extracellular solution containing 2 mm Ca2+ (○) or in the absence of external Ca2+ (no Ca2+ added plus 5 mm EGTA, ●). The experimental protocol is the same as for experiments depicted in Fig. 1C. C, summary of the data for half-time for current onset obtained from n = 5–8 independent experiments, for hypotonically (empty bars) or H2O2 (light gray bars)-stimulated cells in 2 mm external Ca2+ solution or in the absence of external Ca2+. D, time course of Cai2+ signal (averaged fluorescence ratio ± S.E.). Cells were exposed to 33% hypotonicity during the time depicted by the bar in the presence (○, control) or in the absence of external Ca2+ (●). n = 4 independent experiments. *, p < 0.05 compared with control conditions (2 mm Cao2+).
FIGURE 3.
FIGURE 3.
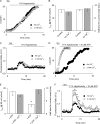
Effect of purinergic receptor activity on VSOR Cl currents. A, representative experiment of the time course of VSOR Cl currents in cells exposed to 33% hypotonicity and 50 μm ruthenium red (▵), 100 μm suramin (○), or 100 nm MRS2175 (□). Currents were recorded at −80 mV every 7 s, and normalized to cell capacitance. B, representative steady-state nystatin-perforated whole-cell current traces obtained using the same protocol as in Fig. 1, A and B of a cell exposed to 33% hypotonicity and 100 μm suramin. C, representative time course of VSOR Cl currents in cells exposed to 200 μm H2O2 and 10 μm ATP in the presence (○) or absence (●) of external Ca2+. The experimental protocol is as in Fig. 1C. D, summary of the data for half-time for current onset obtained from n = 5–6 independent experiments for 33% hypotonic solution (empty bars) or 200 μm H2O2 plus 10 μm ATP (light gray bars)-stimulated cells. E, time course of Cai2+ signal (averaged fluorescence ratio ± S.E.). Cells were exposed to 200 μm H2O2 and 10 μm ATP during the time depicted by the bar in the presence (○, control) or absence of external Ca2+ (●). n = 4 independent experiments. F, time course of Cai2+ signal (averaged fluorescence ratio ± S.E.). Cells were exposed to 33% hypotonicity and 100 μm suramin during the time depicted by the bar in the presence (○, control) or absence of external Ca2+ (●). n = 5 independent experiments. *, p < 0.05 compared with control conditions.
FIGURE 4.
FIGURE 4.
Role of ATP release and P2X4 activation on VSOR Cl currents. A, bulk ATP released from HTC cells measured after 5 min of exposure to 33% hypotonicity (empty bars) or 200 μm H2O2 (light gray bars). n = 3 independent experiments. *, p < 0.05 respect to basal release. B, representative current record of a cell kept at a holding potential of −80 mV exposed to 10 μm ATP. The same cell exposed to a second puff of ATP in the presence of 100 μm suramin. After suramin wash-out, partial recovery of the current is observed. ATP was delivered for the time indicated by the bar using a puffing pipette located nearby the cell. For these experiments, a 15% hypertonic solution was uses to avoid any contribution from volume-sensitive Cl currents. C, representative current record of a cell kept at a holding potential of −80 mV exposed to 10 μm ATP in a cell overexpressing a dominant-negative mutant for P2X4 (P2X4 K313A). The same cell exposed to a second puff of ATP after 15 min of preincubation with 4 μm ivermectin. n = 3–4 independent experiments. D, representative experiments showing the time course VSOR Cl currents evoked by 33% hypotonicity in cells overexpressing P2X4 K313A in the absence (●) or in the presence (○) of 2 mm external Ca2+. Currents were measured at 80 mV every 7 s and normalized by cell capacitance. E, summary of the data presented in D for normalized maximal currents at 80 mV (left axis) and half-time for current onset (right axis) obtained from n = 6 independent experiments. *, p < 0.05 compared with control conditions.
FIGURE 5.
FIGURE 5.
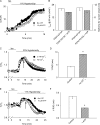
Cao2+ and ATP modulation of 11% hypotonicity-induced VSOR Cl currents. A, representative experiment showing the time course of the development of VSOR Cl currents evoked by 11% hypotonicity in the absence (●) or in the presence (○) of 2 mm external Ca2+. Currents were measured at 80 mV every 7 s and normalized by cell capacitance. B, summary of the data for maximal normalized currents at 80 mV (left axis) and half-time for current onset (right axis) obtained from n = 4–6 independent experiments described in A. C, time course of Cai2+ signal (averaged fluorescence ratio ± S.E.). Cells were exposed to 11% hypotonicity in the absence (●) or in the presence (○) of 2 mm external Ca2+ during the time depicted by the bar. n = 4–5 independent experiments. D, representative experiments showing the time course of VSOR Cl currents evoked by 11% hypotonicity and 10 μm ATP in the absence (●) or in the presence (○) of 2 mm external Ca2+. Currents were measured at 80 mV every 7 s and normalized by cell capacitance. E, summary of the data for normalized maximal currents at 80 mV (left axis) and half-time for current onset (right axis) obtained from n = 4–6 independent experiments described in D. F, time course of Cai2+ signals (averaged fluorescence ratio ± S.E.). Cells were exposed to 11% hypotonicity in the presence of 10 μm ATP (2 mm external Ca2+, ○; 0 mm external Ca2+, ●) during the time depicted by the bar. n = 4–5 independent experiments. *, p < 0.05 compared with control conditions (no ATP added, 2 mm Cao2+).
FIGURE 6.
FIGURE 6.
Effect of P2X4 dominant-negative mutant overexpression on 11% hypotonicity-induced VSOR Cl currents and Cao2+ and ATP on RVD. A, representative experiments showing the time course of VSOR Cl currents evoked by 11% hypotonicity in cells overexpressing the P2X4 K313A dominant-negative construct in the presence of 2 mm external Ca2+ with (●) or without (○) 10 μm ATP. Currents were measured at 80 mV every 7 s and normalized by cell capacitance. B, summary of the data presented in A for normalized maximal currents at 80 mV (left axis) and half-time for current onset (right axis) obtained from n = 5–6 independent experiments. C, cell volume was monitored in single HTC cells loaded with calcein. Representative experiment in which cell swelling was induced by exposure to 33% hypotonicity during the time depicted by the bar is shown. At the time indicated by the arrow, the solution was switched to a NMDG-Cl (replacing all NaCl) containing 10 μm gramicidin solution with (●) or without Cao2+ (○). D, summary of the rate constants obtained by adjusting the fall in cell volume in each case to a single decreasing exponential from experiments depicted in C. Results shown are averages of 15–20 cells measured in single coverslips, n = 3–4 independent experiments. E, cell volume was monitored in single HTC cells loaded with calcein. Representative experiment in which cell swelling was induced by exposure to 11% hypotonicity during the time depicted by the bar is shown. At the time indicated by the arrow, the solution was switched to a NMDG-Cl (replacing all NaCl) containing 10 μm gramicidin solution with (○) or without 10 mm ATP (●) in the presence of 2 mm Cao2+. F, summary of the rate constants obtained by adjusting the fall in cell volume in each case to a single decreasing exponential from experiments depicted in E. Results shown are averages of 15–20 cells measured in single coverslips, n = 3–4 independent experiments. *, p < 0.05 compared with control conditions.

Similar articles

Cited by

References

    1. Friis M. B., Friborg C. R., Schneider L., Nielsen M. B., Lambert I. H., Christensen S. T., Hoffmann E. K. (2005) J. Physiol. 567, 427–443 - PMC - PubMed
    1. Hoffmann E. K. (2000) Cell Physiol. Biochem. 10, 273–288 - PubMed
    1. Shen M. R., Droogmans G., Eggermont J., Voets T., Ellory J. C., Nilius B. (2000) J. Physiol. 529, 385–394 - PMC - PubMed
    1. Shimizu T., Numata T., Okada Y. (2004) Proc. Natl. Acad. Sci. U.S.A. 101, 6770–6773 - PMC - PubMed
    1. Szabò I., Lepple-Wienhues A., Kaba K. N., Zoratti M., Gulbins E., Lang F. (1998) Proc. Natl. Acad. Sci. U.S.A. 95, 6169–6174 - PMC - PubMed

Publication types

LinkOut - more resources