. 2010 Mar 12;285(11):8316-29.
doi: 10.1074/jbc.M109.062521. Epub 2010 Jan 7.

Non-visual arrestins are constitutively associated with the centrosome and regulate centrosome function

Affiliations

Non-visual arrestins are constitutively associated with the centrosome and regulate centrosome function

Haripriya Shankar et al. J Biol Chem. .

Abstract

In addition to regulating receptor activity, non-visual arrestins function as scaffolds for numerous intracellular signaling cascades and as regulators of gene transcription. Here we report that the two non-visual arrestins, arrestin2 and arrestin3, localize to the centrosome, a key organelle involved in microtubule nucleation and bipolar mitotic spindle assembly. Both arrestins co-localized with the centrosomal marker gamma-tubulin during interphase and mitosis and were found in purified centrosome preparations. In vitro binding assays demonstrated that both arrestins directly interact with gamma-tubulin. Knockdown of either arrestin by RNA interference resulted in multinucleation, centrosome amplification, and mitotic defects, although only the loss of arrestin2 triggered aberrant microtubule nucleation. Importantly, overexpression of wild type arrestin rescued the multinucleation phenotype and restored normal centrosome number in arrestin siRNA-transfected cells. Moreover, overexpression of arrestin2 or -3 rescued the multinucleation defect observed in MDA-MB-231 breast cancer cells. Taken together, our data reveal that non-visual arrestins are novel centrosomal components and regulate normal centrosome function.


Figures
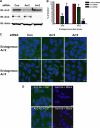
FIGURE 1.
FIGURE 1.
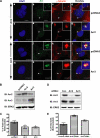
Localization of endogenous arrestin2 and -3. HEK293 cells were transfected with control, arrestin2, or arrestin3 siRNA as described under “Experimental Procedures.” A, shown is a Western blot (IB) demonstrating knockdown of endogenous arrestin2 and -3 levels. Actin staining demonstrates equal protein loading in each lane. B, shown is quantification of percent knockdown of endogenous arrestin2 and -3 levels after siRNA transfection from six independent experiments. C, siRNA-transfected cells were processed for immunofluorescence microscopy using affinity-purified arrestin2 or -3 antibodies. Note the significant decrease in the intensity of arrestin2 and -3 staining in siRNA-transfected cells. D, control siRNA-treated cells were incubated with purified GST protein or with immunizing GST fusion proteins (Block). Note significant dampening of arrestin2 and -3 staining in the presence of the blocking proteins. Ab, antibody; Con, control.
FIGURE 2.
FIGURE 2.
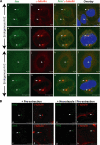
Endogenous arrestin2 and -3 co-localize with γ-tubulin. A, HEK293 cells were fixed and stained with affinity-purified polyclonal arrestin2 (a–h) or arrestin3 (i–p) antibodies and monoclonal γ-tubulin antibody. Representative images of cells in interphase and metaphase are depicted. Arrowheads indicate centrosomes and co-localization (yellow color). Scale bar, 10 μm. B, pre-extracted HEK293 cells were labeled with antibodies to detect endogenous arrestin2 or -3 and γ-tubulin. Arrowheads indicate centrosomes and co-localization. Panels e–h represent images of cells pretreated with nocodazole to de-polymerize the MTs before pre-extraction. Scale bar, 10 μm.
FIGURE 3.
FIGURE 3.
Arrestin2 and -3 interact with γ-tubulin. A, centrosomes were purified according to published procedures. 0.1% each of whole cell lysate (WCL) and crude centrosomes (CC) and 1% of the various fractions were immunoblotted (IB) for γ-tubulin, α-tubulin, PLK1, HSP90, arrestin2, arrestin3, and lamin B using appropriate antibodies. Note that fractions 4–7 were enriched in centrosomal markers and arrestins. B, control, arrestin2, and arrestin3 beads (15 μg) were incubated with equal aliquots of dialyzed and concentrated centrosome fractions, and pulldown assays were performed as described under “Experimental Procedures.” Beads were washed, eluted in 2× SDS sample buffer, and subjected to SDS-PAGE and immunoblotting to detect the amount of bound γ-tubulin. C, control, arrestin2, and arrestin3 beads (15 μg) were incubated with purified recombinant His-γ-tubulin, and pulldown assays were performed as described under “Experimental Procedures.” Beads were washed, eluted, and subjected to SDS-PAGE and immunoblotting to detect the amount of bound γ-tubulin.
FIGURE 4.
FIGURE 4.
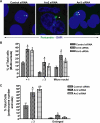
Depletion of arrestin2 or -3 causes multinucleation and centrosome amplification. Control, arrestin2, and arrestin3 siRNA-treated interphasic HEK293 cells were examined for multiple nuclei (A and B) and centrosomal defects (A and C). A, representative images for the multinucleation and centrosomal amplification are depicted. Pericentrin (green) was used to visualize centrosomes, and nuclei were stained with DAPI (blue). Note single intact nuclei and normal pericentrin staining in control cells, whereas cells with multiple nuclei and amplified number of centrosomes were observed in arrestin2 siRNA- and arrestin3 siRNA-transfected cells. Arrowheads indicate multiple centrosomes. Scale bar, 5 μm. B, for the quantification of percent multinucleate cells (>1, ≥3), at least 500 cells were counted from 4 independent experiments. At least 450 cells from 4 independent experiments were analyzed for micronuclei. C, for quantification of the different centrosome defects, at least 500 cells were counted from 6 independent experiments. The single asterisk (*) indicates p < 0.05, and the double asterisk (**) indicates p < 0.005.
FIGURE 5.
FIGURE 5.
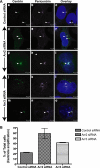
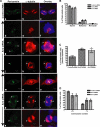
Depletion of arrestin2 or -3 causes centriole amplification. A, representative images are shown of HEK293 cells co-transfected with respective siRNAs and centrin-GFP (0.5 μg) to visualize the centrioles. Only interphasic cells were analyzed for centrosome amplification. Panels a–c depict centriole and centrosome staining (pericentrin, purple) in control siRNA-transfected cells. Centriole amplification after arrestin knockdown was observed in both mono- and multinucleated cells. Boxes d–f and g–i represent mononucleated and multinucleated arrestin2 siRNA-treated cells, respectively. Boxes j–l and m–o represent mononucleated and multinucleated arrestin3 siRNA-treated cells, respectively. In some cells excess PCM fragmentation is seen (boxes d–i). Also note centrioles lacking associated PCM or PCM lacking centrioles in arrestin2 and -3-depleted cells (panels d–f and j–l). B, shown is quantification of the percent centriole amplification in control, arrestin2, and arrestin3 siRNA-transfected cells. Data are quantified from 80–100 cells from 2 independent experiments and are represented as the average ± S.E.
FIGURE 6.
FIGURE 6.
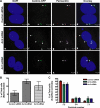
Arrestin depletion triggers centriole amplification and multinucleation in HeLa cells. A, representative images are shown of HeLa cells stably overexpressing centrin-GFP, transfected with control (a–d), arrestin2 (e–h), or arrestin3 siRNA (i–l). Only interphasic cells were analyzed for multinucleation and centrosome amplification defects. Note normal nucleus and centrioles/centrosomes in control siRNA-treated HeLa cells. Centriole amplification was observed in multinucleated arrestin2 or arrestin3 siRNA-transfected cells. Shown is quantification of multinucleation (B) and centriole amplification (C) in siRNA-treated HeLa cells. More than 500 cells were counted from 3 independent experiments for quantification of multinucleation defect, and >140 cells were counted from 3 independent experiments for quantification of centriole amplification (≥5). The single asterisk (*) indicates p < 0.05, and double asterisk (**) indicates p < 0.005. Data are represented as average ± S.E.
FIGURE 7.
FIGURE 7.
Overexpression of arrestin2 and -3 rescues the multinucleate and centrosome amplification defects. Control, arrestin2, and arrestin3 siRNA-treated HEK293 cells were transfected with GFP vector, arrestin2-GFP, or arrestin3-GFP. Only interphasic cells expressing low, medium, or high levels of GFP were analyzed for the rescue of the multinucleate phenotype and centrosome amplification. Pericentrin was used to visualize centrosomes, and nuclei were stained with DAPI. A, for quantification of percent rescue of the multinucleate phenotype, more than 140 cells were analyzed from 4 independent experiments. B, for quantification of percent rescue of centrosome amplification, more than 100 cells were analyzed from 4 independent experiments. The single asterisk (*) indicates p < 0.05, and the double asterisk (**) indicates p < 0.005. Data are represented as the average ± S.E. C, shown is quantification of the rescue of the multinucleate phenotype (≥3 nuclei). HEK293 cells were transfected with control siRNA plus GFP, arrestin2 siRNA plus GFP, arrestin2 siRNA plus arrestin2-GFP, arrestin3 siRNA plus GFP, or arrestin3 siRNA plus arrestin3-GFP. At least 140 cells were counted from 3 independent experiments and were analyzed for ≥3 nuclei per cell. Data are represented as the average ± S.E.
FIGURE 8.
FIGURE 8.
Localization of arrestin and arrestin-mediated rescue of centrosome defects in the breast cancer cell line MDA-MB-231. A, shown are representative images of MDA-MB-231 cells stably overexpressing either pcDNA3, arrestin2, or arrestin3, fixed, and stained with γ-tubulin and either arrestin2 (panels a–h) or arrestin3 (panels i–p) antibodies. Arrowheads denote centrosomes and co-localization. Scale bar, 10 μm. B, shown is a Western blot (IB) demonstrating the levels of arrestin2 or -3 in stably overexpressing cells as compared with pcDNA3-transfected cells. The ERK2 blot indicates equal amounts of protein loading in each lane. C, for the quantification of percent multinucleated cells after overexpression of arrestin2 or -3, at least 430 cells were counted from 6 independent experiments. D, shown is a Western blot demonstrating significant reduction in levels of endogenous arrestin2 and -3 after siRNA transfection. The ERK2 blot indicates equal amounts of protein loading in each lane. E, wild type MDA-MB-231 cells were transfected with control, arrestin2, or arrestin3 siRNA and examined for a multinucleate defect. For quantification of percent multinucleate cells, at least 150 cells were analyzed from 3 independent experiments. The single asterisk (*) indicates p < 0.05. Data are represented as the average ± S.E.
FIGURE 9.
FIGURE 9.
Loss of arrestin2 or -3 promotes multipolar mitoses and spindle defects. A, representative images are shown of metaphasic HEK293 cells transfected with control (panels a–c), arrestin2 (panels d–l), or arrestin3 (panels m–u) siRNA. Pericentrin was used to visualize centrosomes, α-tubulin was used to stain the mitotic spindle, and condensed chromatin was stained with DAPI. Note two control cells in the depicted frame with normal pericentrin staining at the spindle pole and a normal bipolar spindle. Panels d–f and m–o represent arrestin2 and arrestin3 siRNA-treated cells with abnormal spindles; g–i and p–r represent arrestin2 and -3 siRNA-treated cells with multipolar spindles; j–l and s–u depict arrestin2 and -3 siRNA-treated cells with centrosome clustering at the poles. Scale bar, 10 μm. B, for the quantification of percent multipolar mitoses, 250 mitotic cells were counted from an asynchronous population. C, for quantification of spindle defects, at least 90 cells were analyzed from four independent experiments. D, shown is quantification of centrosome amplification (≥3) in mitotic cells. The single asterisk (*) indicates p < 0.05, the double asterisk (**) indicates p < 0.005, and the triple asterisk (***) indicates p < 0.001. Data are represented as the average ± S.E.

Similar articles

Cited by

References

    1. Kellogg D. R., Moritz M., Alberts B. M. (1994) Annu. Rev. Biochem. 63, 639–674 - PubMed
    1. Bornens M. (2002) Curr. Opin. Cell Biol. 14, 25–34 - PubMed
    1. King R. W., Peters J. M., Tugendreich S., Rolfe M., Hieter P., Kirschner M. W. (1995) Cell 81, 279–288 - PubMed
    1. Tugendreich S., Tomkiel J., Earnshaw W., Hieter P. (1995) Cell 81, 261–268 - PubMed
    1. Bailly E., Dorée M., Nurse P., Bornens M. (1989) EMBO J. 8, 3985–3995 - PMC - PubMed

Publication types

MeSH terms

LinkOut - more resources