. 2010 Mar 5;285(10):7447-58.
doi: 10.1074/jbc.M109.090753. Epub 2010 Jan 7.

Transient and big are key features of an invertebrate T-type channel (LCav3) from the central nervous system of Lymnaea stagnalis

Affiliations

Transient and big are key features of an invertebrate T-type channel (LCav3) from the central nervous system of Lymnaea stagnalis

Adriano Senatore et al. J Biol Chem. .

Abstract

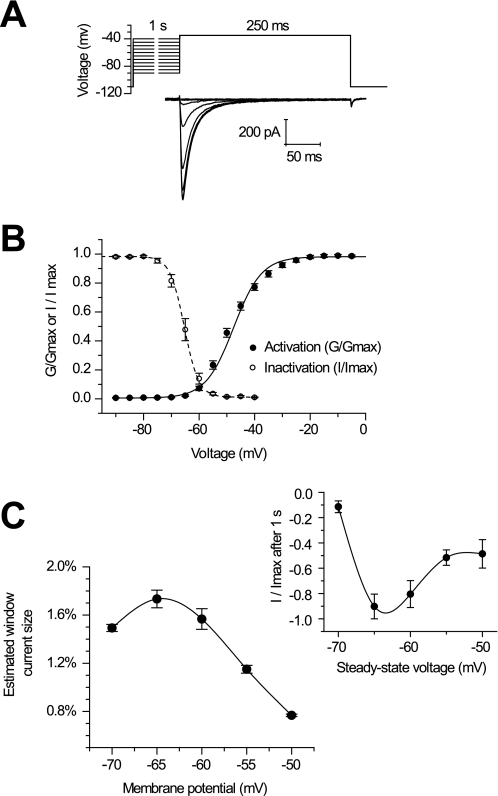
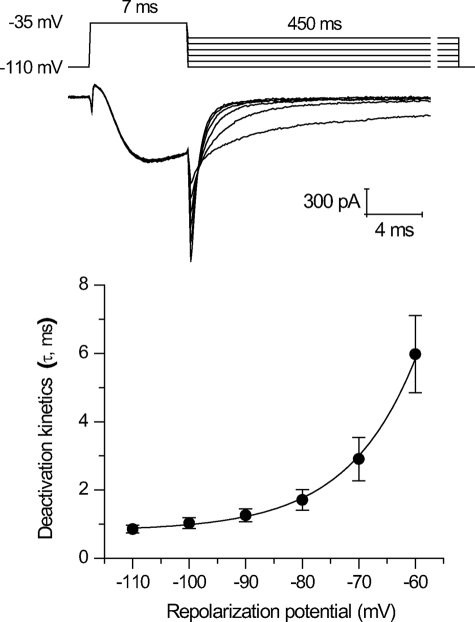
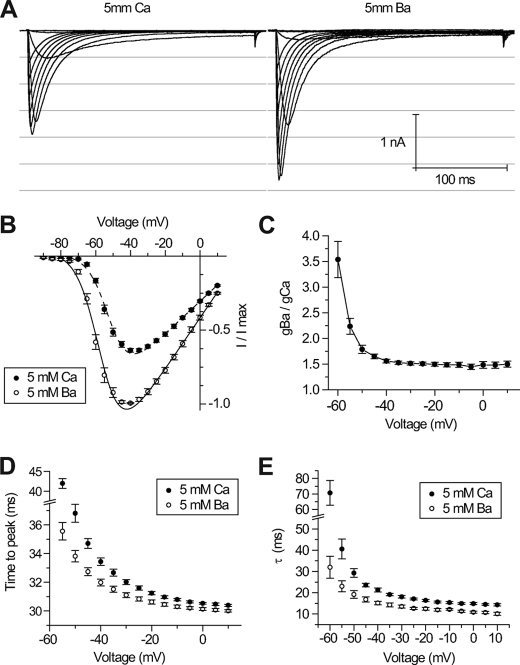
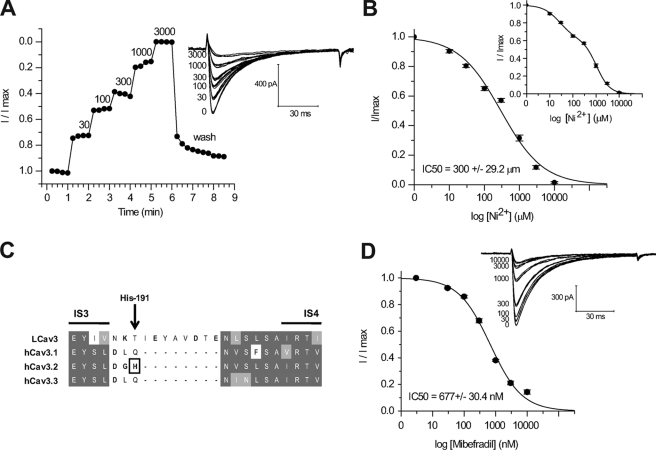
Here we describe features of the first non-mammalian T-type calcium channel (LCa(v)3) expressed in vitro. This molluscan channel possesses combined biophysical properties that are reminiscent of all mammalian T-type channels. It exhibits T-type features such as "transient" kinetics, but the "tiny" label, usually associated with Ba(2+) conductance, is hard to reconcile with the "bigness" of this channel in many respects. LCa(v)3 is 25% larger than any voltage-gated ion channel expressed to date. It codes for a massive, 322-kDa protein that conducts large macroscopic currents in vitro. LCa(v)3 is also the most abundant Ca(2+) channel transcript in the snail nervous system. A window current at typical resting potentials appears to be at least as large as that reported for mammalian channels. This distant gene provides a unique perspective to analyze the structural, functional, drug binding, and evolutionary aspects of T-type channels.


Figures

FIGURE 1.
FIGURE 1.
Full-length snail LCav3 is the largest identified voltage-gated ion channel expressed to date. It is coded by a 9031-bp cDNA transcript that forms a 2886-amino acid protein with a molecular mass of 322 kDa. A, the N terminus closely matches with a putative start site derived from marine snail A. californica EST (EB302921) and slightly resembles the N and C termini of human Cav3.1–3.3. B, LCav3 is 1.25× larger than human Cav3 channels and 1.5× larger than nematode T-type, cca-1B, and all other four repeat ion channels. C, LCav3 is larger than human Cav3 channels in the N and C terminus and also the I-II and II-III cytoplasmic linkers.
FIGURE 2.
FIGURE 2.
Singleton, snail T-type Ca2+ channel gene is distantly related to vertebrate homologs and is the most abundant Ca2+ channel transcript in the snail brain. A, shown is the most parsimonious gene tree generated using multiple aligned sequences, analyzed in PAUP4.0 (D. L. Swofford) and illustrated with TreeView (R. D. M. Page). Sequences include official human sequences (IUPHAR database); LCav3 (GenBankTM accession no. AF484084) and yeast gene Cch1 from Schizosaccharomyces pombe (GenBankTM accession no. CAB11726) and Saccharomyces cerevisiae (GenBankTM accession no. CAA97244). Numbers at branch points represent bootstrap values based on 100 replicates in heuristic search. Phylogram branches are scaled by their length and rooted with Cch1 Ca2+ channel homologs from fungi species. C, percent amino acid similarity scores were generated from EMBOSS NEEDLE (EMBL). B, Southern blot indicates a single copy gene in the Lymnaea genome. A T-type probe hybridized to create a banding pattern (white arrows) on the blot was created from membrane transfer of genomic DNA digested with either EcoRV(a), HindIII (b), EcoRI (c), or XhoI (d). The probe contained an EcoRV restriction site, so the probe hybridized to two genomic DNA fragments digested with EcoRV. D, densitometric intensity of RT-PCR bands (illustrated in the inset) was generated from Lymnaea brain tissue.
FIGURE 3.
FIGURE 3.
Running window of similarity (A) and alignments (B and C) between amino acid sequences of distant T-type channel homologs (snail LCav3 and human Cav3.3) reveal that the invariant structures for T-type channels are harbored in six membrane-spanning segments in all four domains (I, II, III, and IV), including an ion conducting pore (S5-P-loop-S6) and voltage sensor (S1-S4). Illustrated is the position in the I-II linker where LCav3 polyclonal antibody (Ab) was generated in rabbits against a 200-amino acid peptide. B, shown is amino acid sequence alignment of the re-entrant P-loop located between S5 and S6 of each of the four domains illustrating the signature sequence (EEDD locus) that influences Ca2+ ion permeation and selectivity. The conserved aspartate residue (1097 in LCav3) in a position downstream of the selectivity filter glutamate residue is positioned to attract incoming Ca2+ ions to the pore.3 LCav3 contains a neutral isoleucine in the outer pore at position 468 where mammalian T-type channels have a negatively charged residue (Glu or Asp) that influence pore blocking drugs. C, alignment of the cytoplasmic gating brake in proximal I-II linker is shown. The gating brake is thought to prevent T-type channel gating at more hyperpolarized potentials.
FIGURE 4.
FIGURE 4.
Transient transfection of HEK-293T cells harboring the pIRES2-EGFP plasmid containing invertebrate T-type channel cDNA reveal highly abundant channels and characteristic T-type channel properties. A, membrane delimited staining of LCav3 (inset) is evident in EGFP-positive cells but only with LCav3-specific antibody and not with preimmune serum or with LCav1-transfected cells. B, the box chart indicates the current density (pA/pF (picofarads)) of LCav3 expression on 3 or 6 days after transfection. The box chart also illustrates mean, median ± 1 S.D., min/max current densities. C, sample LCav3 currents are shown in response to 5-ms voltage steps from a −110-mV holding potential. Illustrated is an ensemble of rapidly activating and inactivating Ca2+ currents where each trace “crosses over” the previous one from rest to peak, and the resulting normalized peak currents are plotted as a function of voltage step, indicating low threshold of activation (−65 mV) and maximal currents generated at a step to −35 mV (D). Current-voltage relationships were curve-fitted with an Ohmic-Boltzmann function. E, the increase in inactivation kinetics (τinact) closely follows the increasing speed at which the current approaches peak (tpeak), also reflected in the faster rate of activation, curve-fitted and represented by τact.
FIGURE 5.
FIGURE 5.
Invertebrate LCav3 has a large, persistent window current up to 1.8% of the total current near the resting membrane potential. A, sample current traces of maximal Cav3 currents (step to −35 mV) in response to a 1-s inactivating prepulse. B, a Boltzmann-fitted inactivation curve was generated by plotting the fraction of maximal current as a function of prepulse voltage. The fraction of maximal conductance at each voltage was plotted as an activation curve, curve-fitted with a Boltzmann function. The activation curve was derived from the current-voltage relationship minus the ohm-changes due to the driving force (illustrated in Fig 4D). C, calculation of the window currents were based on the product of the fraction of the whole cell conductance and fraction of available, non-inactivated channels at each voltage. Inset, a window current was measured at the end of a long, 1-s voltage-step. At 1 s, the majority of open channels will have been inactivated, leaving only open channels that persist under steady-state conditions, with a maximum at the resting membrane potential (−65 mV).
FIGURE 6.
FIGURE 6.
Invertebrate LCav3 slowly deactivates similar to mammalian T-type channels. Sample tail currents and curve fitting of decay rate of tail currents (τ, ms) were generated by hyperpolarizing steps between −110 and −60 mV for 450 ms from a 7-ms depolarizing step to −35 mV.
FIGURE 7.
FIGURE 7.
LCav3 currents are larger and faster when Ba2+ is the charge carrier. Sample traces (A) and current-voltage relationships (B) of LCav3 currents were generated from depolarizing voltage steps from a holding potential of −110 mV while microperfusing extracellular solution containing either 5 mm Ba2+ or 5 mm Ca2+. Whole cell Ba2+ conductance was estimated to be ∼50% greater than Ca2+ conductance at all voltages (C). Kinetics of activation (time to peak current, ms) (D) and inactivation decay (tau curve fit, ms) (E) are faster when barium instead of calcium is the charge carrier.
FIGURE 8.
FIGURE 8.
Invertebrate T-type channels have similar Ni2+ and mibefradil sensitivity as mammalian T-types. A, shown is the time course of Ni2+ inhibition of normalized LCav3 peak currents (inset, representative traces). B, cumulative dose-response is illustrated, with an IC50 (300 ± 29.2 μm) value that overlaps with IC50 of Cav3.1 (304.8 ± 6.2 μm; Kang et al. (16)). Inset, a better fit illustrated with a biphasic dose-response curve is shown. C, T-type channel alignments in the region of the S3b-S4 paddle of Domain I illustrate the His-191 required for high Ni2+ sensitivity of Cav3.2 channels. LCav3 has an eight-amino acid insert with additional charged residues in the relative position of the His-191 residue in Cav3.2. D, shown is a cumulative dose-response curve of mibefradil block of LCav3 (inset, representative traces), indicating an IC50 (300 ± 29.2 μm) value that is reminiscent of the IC50 for mammalian Cav3 channels.

Similar articles

Cited by

References

    1. Kim D., Song I., Keum S., Lee T., Jeong M. J., Kim S. S., McEnery M. W., Shin H. S. (2001) Neuron 31, 35–45 - PubMed
    1. Chemin J., Monteil A., Briquaire C., Richard S., Perez-Reyes E., Nargeot J., Lory P. (2000) FEBS Lett. 478, 166–172 - PubMed
    1. Lory P., Bidaud I., Chemin J. (2006) Cell Calcium 40, 135–146 - PubMed
    1. Shin H. S., Cheong E. J., Choi S., Lee J., Na H. S. (2008) Curr. Opin. Pharmacol. 8, 33–41 - PubMed
    1. Hagiwara S., Ozawa S., Sand O. (1975) J. Gen. Physiol 65, 617–644 - PMC - PubMed

Publication types

MeSH terms

Associated data