

Interspecific gene flow in a multispecies oak hybrid zone in the Sierra Tarahumara of Mexico
- PMID: 20056653
- PMCID: PMC2826251
- DOI: 10.1093/aob/mcp301
Interspecific gene flow in a multispecies oak hybrid zone in the Sierra Tarahumara of Mexico
Abstract
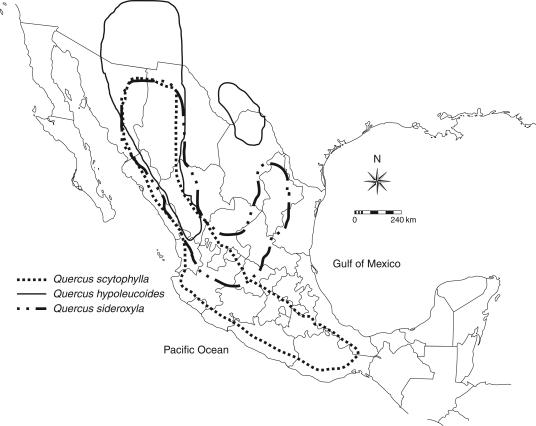
Background and aims: Interspecific gene flow can occur in many combinations among species within the genus Quercus, but simultaneous hybridization among more than two species has been rarely analysed. The present study addresses the genetic structure and morphological variation in a triple hybrid zone formed by Q. hypoleucoides, Q. scytophylla and Q. sideroxyla in north-western Mexico.
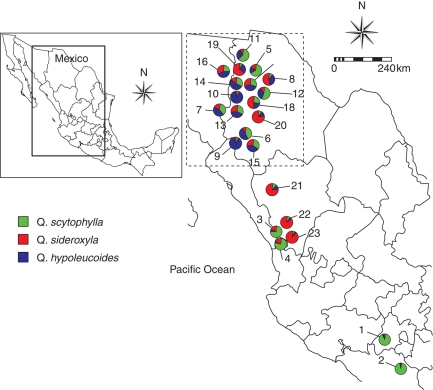
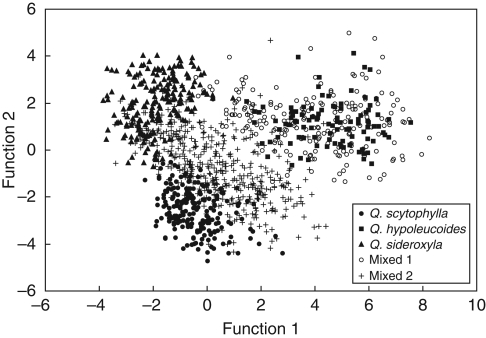
Methods: A total of 247 trees from ten reference and 13 presumed intermediate populations were characterized using leaf shape variation and geometric morphometrics, and seven nuclear microsatellites as genetic markers. Discriminant function analysis was performed for leaf shape variation, and estimates of genetic diversity and structure, and individual Bayesian genetic assignments were obtained.
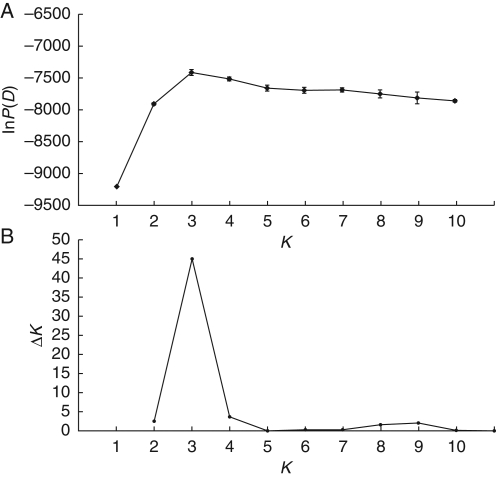
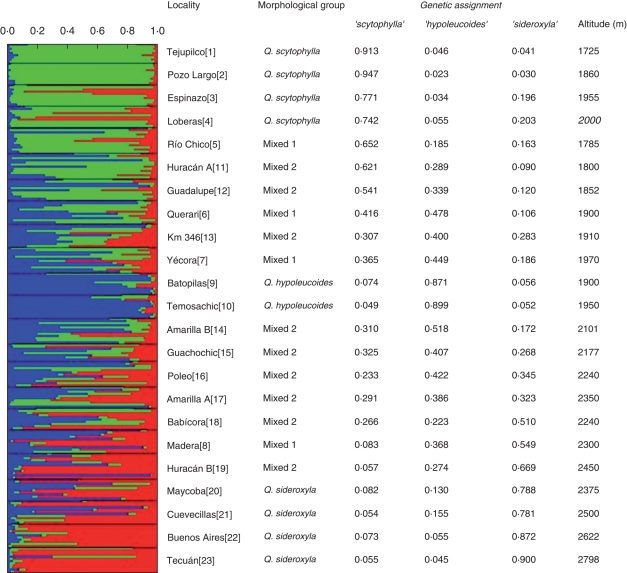
Key results: Reference populations formed three completely distinct groups according to discriminant function analysis based on the morphological data, and showed low, but significant, genetic differentiation. Populations from the zone of contact contained individuals morphologically intermediate between pairs of species in different combinations, or even among the three species. The Bayesian admixture analysis found that three main genetic clusters best fitted the data, with good correspondence of reference populations of each species to one of the genetic clusters, but various degrees of admixture evidenced in populations from the contact area.
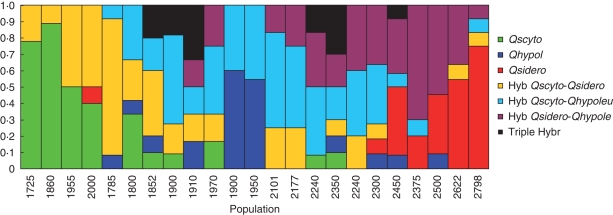
Conclusions: The three oak species have formed a complex hybrid zone that is geographically structured as a mosaic, and comprising a wide range of genotypes, including hybrids between different species pairs, backcrosses and probable triple hybrids.
Figures
References
-
- Aldrich PR, Michler CH, Sun W, Romero-Severson J. Microsatellites markers for northern red oak (Fagaceae: Quercus rubra) Molecular Ecology Notes. 2002;2:472–474.
-
- Arnold ML. Iris nelsonii (Iridaceae): origin and genetic composition of a homoploid hybrid species. American Journal of Botany. 1993;80:577–583. - PubMed
-
- Arnold ML. Natural hybridization and evolution. Oxford: Oxford University Press; 1997.
-
- Barton NH, Gale KS. Genetic analysis of hybrid zones. In: Harrison RG, editor. Hybrid zones and the evolutionary process. Oxford: Oxford University Press; 1993. pp. 13–45.
-
- Barton NH, Hewitt GM. Analysis of hybrid zones. Annual Review of Ecology and Systematics. 1985;16:113–148.
