

An EGFR autocrine loop encodes a slow-reacting but dominant mode of mechanotransduction in a polarized epithelium
- PMID: 20056713
- PMCID: PMC2879944
- DOI: 10.1096/fj.09-145367
An EGFR autocrine loop encodes a slow-reacting but dominant mode of mechanotransduction in a polarized epithelium
Abstract
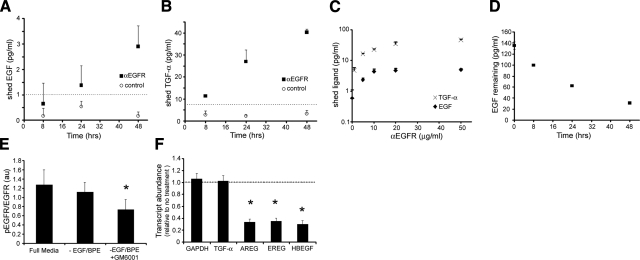
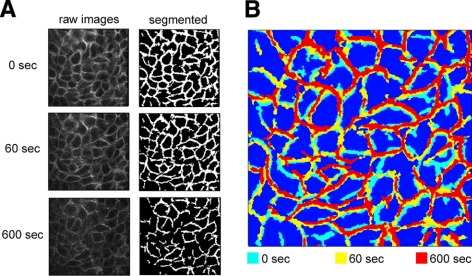
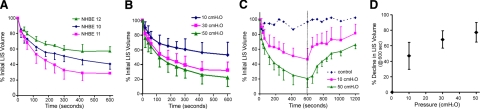
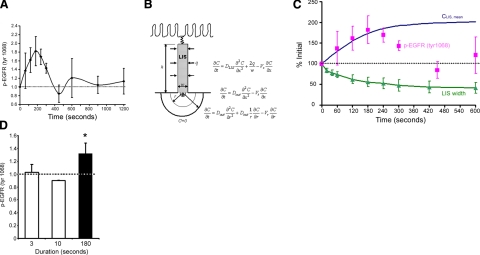
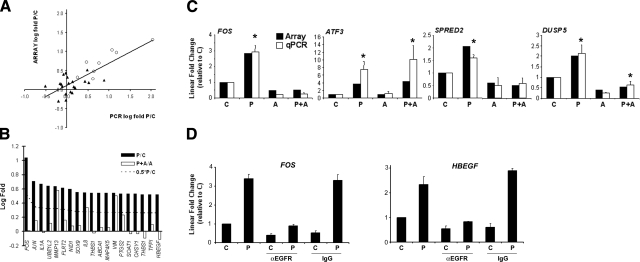
The mechanical landscape in biological systems can be complex and dynamic, with contrasting sustained and fluctuating loads regularly superposed within the same tissue. How resident cells discriminate between these scenarios to respond accordingly remains largely unknown. Here, we show that a step increase in compressive stress of physiological magnitude shrinks the lateral intercellular space between bronchial epithelial cells, but does so with strikingly slow exponential kinetics (time constant approximately 110 s). We confirm that epidermal growth factor (EGF)-family ligands are constitutively shed into the intercellular space and demonstrate that a step increase in compressive stress enhances EGF receptor (EGFR) phosphorylation with magnitude and onset kinetics closely matching those predicted by constant-rate ligand shedding in a slowly shrinking intercellular geometry. Despite the modest degree and slow nature of EGFR activation evoked by compressive stress, we find that the majority of transcriptomic responses to sustained mechanical loading require ongoing activity of this autocrine loop, indicating a dominant role for mechanotransduction through autocrine EGFR signaling in this context. A slow deformation response to a step increase in loading, accompanied by synchronous increases in ligand concentration and EGFR activation, provides one means for cells to mount a selective and context-appropriate response to a sustained change in mechanical environment.
Figures
Similar articles
-
A model for mechanotransduction in cardiac muscle: effects of extracellular matrix deformation on autocrine signaling.Ann Biomed Eng. 2004 Oct;32(10):1319-35. doi: 10.1114/b:abme.0000042221.61633.23. Ann Biomed Eng. 2004. PMID: 15535051
-
Bronchial epithelial compression regulates epidermal growth factor receptor family ligand expression in an autocrine manner.Am J Respir Cell Mol Biol. 2005 May;32(5):373-80. doi: 10.1165/rcmb.2004-0266OC. Epub 2005 Feb 10. Am J Respir Cell Mol Biol. 2005. PMID: 15705969
-
Mechanotransduction through growth-factor shedding into the extracellular space.Nature. 2004 May 6;429(6987):83-6. doi: 10.1038/nature02543. Epub 2004 Apr 21. Nature. 2004. PMID: 15103386 Free PMC article.
-
EGFR autocrine signaling in a compliant interstitial space: mechanotransduction from the outside in.Cell Cycle. 2004 Aug;3(8):996-7. doi: 10.4161/cc.3.8.1062. Epub 2004 Aug 25. Cell Cycle. 2004. PMID: 15254423 Review.
-
Trafficking of epidermal growth factor receptor ligands in polarized epithelial cells.Annu Rev Physiol. 2014;76:275-300. doi: 10.1146/annurev-physiol-021113-170406. Epub 2013 Nov 8. Annu Rev Physiol. 2014. PMID: 24215440 Free PMC article. Review.
Cited by
-
YAP forms autocrine loops with the ERBB pathway to regulate ovarian cancer initiation and progression.Oncogene. 2015 Dec 10;34(50):6040-54. doi: 10.1038/onc.2015.52. Epub 2015 Mar 23. Oncogene. 2015. PMID: 25798835 Free PMC article.
-
Genomic signatures of the unjamming transition in compressed human bronchial epithelial cells.Sci Adv. 2021 Jul 23;7(30):eabf1088. doi: 10.1126/sciadv.abf1088. Print 2021 Jul. Sci Adv. 2021. PMID: 34301595 Free PMC article.
-
Oleanolic acid induces migration in Mv1Lu and MDA-MB-231 epithelial cells involving EGF receptor and MAP kinases activation.PLoS One. 2017 Feb 23;12(2):e0172574. doi: 10.1371/journal.pone.0172574. eCollection 2017. PLoS One. 2017. PMID: 28231262 Free PMC article.
-
Putting the Squeeze on Airway Epithelia.Physiology (Bethesda). 2015 Jul;30(4):293-303. doi: 10.1152/physiol.00004.2015. Physiology (Bethesda). 2015. PMID: 26136543 Free PMC article. Review.
-
Coming to terms with tissue engineering and regenerative medicine in the lung.Am J Physiol Lung Cell Mol Physiol. 2015 Oct 1;309(7):L625-38. doi: 10.1152/ajplung.00204.2015. Epub 2015 Aug 7. Am J Physiol Lung Cell Mol Physiol. 2015. PMID: 26254424 Free PMC article. Review.
References
-
- Tzima E, Irani-Tehrani M, Kiosses W B, Dejana E, Schultz D A, Engelhardt B, Cao G, DeLisser H, Schwartz M A. A mechanosensory complex that mediates the endothelial cell response to fluid shear stress. Nature. 2005;437:426–431. - PubMed
-
- Wang Y, Botvinick E L, Zhao Y, Berns M W, Usami S, Tsien R Y, Chien S. Visualizing the mechanical activation of Src. Nature. 2005;434:1040–1045. - PubMed
-
- Matthews B D, Overby D R, Mannix R, Ingber D E. Cellular adaptation to mechanical stress: role of integrins, Rho, cytoskeletal tension and mechanosensitive ion channels. J Cell Sci. 2006;119:508–518. - PubMed
Publication types
MeSH terms
Substances
Grants and funding
LinkOut - more resources
Full Text Sources
Molecular Biology Databases
Research Materials
Miscellaneous
