. 2010 May;24(5):1572-82.
doi: 10.1096/fj.09-137281. Epub 2010 Jan 7.

Fluorosomes: a convenient new reagent to detect and block multivalent and complex receptor-ligand interactions

Affiliations

Fluorosomes: a convenient new reagent to detect and block multivalent and complex receptor-ligand interactions

Hans J Kueng et al. FASEB J. 2010 May.

Abstract

We describe for the first time fluorescent virus-like particles decorated with biologically active mono- and multisubunit immune receptors of choice and the basic application of such fluorosomes (FSs) to visualize and target immune receptor-ligand interactions. For that purpose, human embryonic kidney (HEK)-293 cells were stably transfected with Moloney murine leukemia virus (MoMLV) matrix protein (MA) GFP fusion constructs. To produce FSs, interleukins (ILs), IL-receptors (IL-Rs), and costimulatory molecules were fused to the glycosyl phosphatidyl inositol anchor acceptor sequence of CD16b and coexpressed along with MoMLV group-specific antigen-polymerase (gag-pol) in MA::GFP(+) HEK-293 cells. We show that IL-2 decorated but not control-decorated FSs specifically identify normal and malignant IL-2 receptor-positive (IL-2R(+)) lymphocytes by flow cytometry. In addition to cytokines and costimulatory molecules, FSs were also successfully decorated with the heterotrimeric IL-2Rs, allowing identification of IL-2(+) target cells. Specificity of binding was proven by complete inhibition with nonlabeled, soluble ligands. Moreover, IL-2R FSs efficiently neutralized soluble IL-2 and thus induced unresponsiveness of T cells receiving full activation stimuli via T-cell antigen receptor and CD28. FSs are technically simple, multivalent tools for assessing and blocking mono- and multisubunit immune receptor-ligand interactions with natural constituents in a plasma membrane context.


Figures
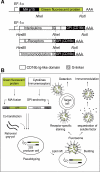
Figure 1.
Figure 1.
A) Diagram of expression constructs. DNA sequences encoding MoMLV MA (p15) were PCR amplified and endowed with flanking HindIII and NheI restriction sites. For optimal expression levels, the consensus transcriptional initiation site GCCACC was introduced upstream of the ATG codon. The MA coding region was fused to GFP sequences previously inserted in the pEAK12 expression vector. Cytokine coding sequences were similarly PCR amplified and prepared for vector insertion. At the 3′ ends of the cytokine cDNAs, the intrinsic stop codons were replaced by a polyglycine linker sequence allowing fusion to a CD16b GPI-anchor acceptor sequence (in the case of interleukins preceded by 2 CD16b Ig-like domains) previously inserted in the pEAK12 vector. B) Production scheme for FSs. FS production is initiated by transfection of MoMLV gag-pol. FS bud from the lipid raft regions of HEK-293 producer cell membranes. MA::GFP is targeted to the lipid rafts and consequently to nascent FSs by virtue of its fusion to MA. Similarly, the cytokines, cytokine receptors, and costimulatory molecules fused to the GPI-anchor acceptor sequence of CD16b become enriched in lipid rafts and FSs. After collection and purification from HEK-293 producer cell supernatants, FSs can be used to visualize receptor-ligand interactions by standard flow cytometry and microscopy, or, alternatively, for cytokine sequestration.
Figure 2.
Figure 2.
A, B) Analysis of HEK-293 producer cells. HEK-293 cells stably transfected with MA::GFP (A) or GFP (B) were seeded in a cell cultivation chamber, grown overnight, and analyzed by confocal microscopy (×63/1.40 oil immersion). Images show characteristic morphology and fluorescence pattern. Inset: high magnification. Scale bar = 50 μm. C, D) Flow cytometric determination of GFP expression levels in HEK-293 producer cells. Overlay histograms show green fluorescence intensity of HEK-293 cells stably expressing MA::GFP (C) or GFP (D) (solid lines) compared to native HEK-293 cells (dotted lines) as determined by flow cytometry. Numbers indicate geometric MFI. E) GPI anchor attachment or fusion to MA targets modified molecules to lipid rafts. HEK-293 cells transfected with IL-2::GPI, MoMLV gag/pol, MA::GFP, or GFP, respectively, were lysed at 4°C in Triton X-100 and fractionated on 5 to 40% sucrose gradients into 9 fractions (top to bottom). Equal amounts of each fraction were resolved by SDS-PAGE, blotted, and probed by immunoblotting (IB) with mAbs specific for IL-2 (all antibodies used are listed in Supplemental Table 2), p30Gag, GFP, CD59, or CD147, respectively. Binding of antibodies was visualized by HRP-conjugated secondary reagents followed by a luminol-based detection reaction. One of several representative experiments is shown.
Figure 3.
Figure 3.
Binding of IL-2-decorated fluorescent VLPs to IL-2R+ HT-2 cells. A, B) Dose-dependent binding. Saturation binding isotherms were generated by reacting 2-fold dilutions of the indicated amounts of purified IL-2::GPI MA::GFP+VLPs (solid squares), control MA::GFP+VLPs (open squares), IL-2::GPI GFP+VLPs (solid circles), and control GFP+VLPs (open circles) with HT-2 cells (starting with 400 μg VLPs/1×105 HT-2 cells) followed by flow cytometric analyses. Percentage positive cells (A) and geometric mean fluorescence intensity (geo MFI) (B) obtained are plotted against the VLP concentrations applied. Native HT-2 cells exhibited a geo MFI of 5 (<2% positive cells). Dotted line indicates ED50. **P < 0.01, ***P < 0.001; 2-tailed Mann Whitney U test. C) VLP-based detection of IL-2R on HT-2 cells by standard microscopy. HT-2 cells were incubated and processed with IL-2::GPI MA::GFP+VLPs or control MA::GFP+VLPs as described above. Cell morphology was determined by light microscopy (right), membrane fluorescence by fluorescence microscopy (left). Scale bar = 10 μm. D) Overlay histograms of HT-2 cells (1×10⁵) incubated with 30 μg IL-2::GPI-MA::GFP+VLPs or control MA::GFP+VLPs (top panel), IL-2::GPI-GFP+VLPs or control GFP+VLPs (middle panel), and αCD25 mAbs or control mAbs (bottom panel). Specific fluorescence (solid lines) is compared to the respective control (dotted lines). Numbers indicate geo MFI values of specific reagents. E) Differential targeting of MA::GFP and GFP to VLPs. HEK-293 cells were transfected with the indicated expression plasmids or control plasmid and cell lysates (cells) and corresponding VLP preparations were analyzed by SDS-PAGE under reducing conditions followed by immunoblotting (IB) with a GFP-specific goat antiserum or the p30 Gag-specific mAb R187, respectively. Bound antibodies were detected by HRP-conjugated secondary reagents and a luminol-based detection system. ***P < 0.001; paired, 2-tailed Student’s t test. F) Exogenous IL-2 inhibits binding of IL-2::GPI MA::GFP+VLPs. Native HT-2 cells (1×10⁵) or HT-2 cells preincubated with recombinant soluble human IL-2 (5×10³ U) were incubated with IL-2::GPI-decorated MA::GFP+VLPs and analyzed by flow cytometry. Results show binding of IL-2::GPI-decorated MA::GFP+VLPs to IL-2 preincubated relative to native HT-2 cells (means+sd). G) Temperature-dependent dissociation of IL-2::GPI MA::GFP+VLPs from HT-2 cells. Dissociation of IL-2::GPI MA::GFP+VLPs from HT-2 cells was monitored after removing excess VLPs and chasing at 4°C, room temperature (RT), 37°C, and 37°C in the presence of 4 × 10⁴ U soluble IL-2. MFI was determined and plotted as percentage of maximum, corresponding to the values obtained at start of chase. t1/2, dissociation half-life.
Figure 4.
Figure 4.
IL-2::GPI FSs discriminate between target cells expressing low- or high-affinity IL-2Rs. A) Overlay histograms of HEK-293 cells transfected with control plasmid (top panel), IL-2R βγ-chain (middle panel), or IL-2R αβγ-chain (bottom panel) stained with identical batches of either IL-2::GPI (solid line) or control (dotted line) FSs. B) Geometric MFI + sd values of indicated HEK-293 cell transfectants stained with IL-2::GPI (black bars) or control (white bar) FSs from 3 independently performed experiments. ***P < 0.001; paired, 2-tailed Student’s t test.
Figure 5.
Figure 5.
A, B) IL-2::GPI FSs identify activated T lymphocytes and CLL B cells. Two-parameter dot-plot analyses of freshly isolated (A) or activated (αCD3/αCD28 coated beads, 48 h) PBMCs (B) on incubation with IL-2::GPI FSs, control FSs, or CD25 FITC-conjugated mAbs and counterstained with a CD3 APC-conjugated mAbs. Gating for lymphocytes was performed according to typical FSC/SSC characteristics. Markers were set according to nonbinding control mAbs or control FSs. Data are representative of 3 experiments. C) Whole blood of a CLL patient was stained with IL-2::GPI FSs, control FSs, or CD25 FITC-conjugated mAbs and counterstained with a CD19 APC-conjugated mAb. Lymphocytes were gated according to typical FSC/SSC characteristics. Markers were set according to staining of nonbinding control mAbs or control FSs. Data are representative of multiple individuals (n=11). D) IL-7::GPI FSs or CD80::GPI FSs specifically bind to target cells expressing their respective receptors. Two-parameter dot-plot analyses of whole blood cells gated on lymphocytes of a representative healthy donor incubated with IL-7::GPI FSs, control FSs, or CD127 PE-conjugated mAbs and counterstained with CD3 APC-conjugated mAbs. Lymphocytes were gated according to typical FSC/SSC characteristics. Data are representative of 4 experiments. E) Overlay histograms of CTLA-4 transfected BW cells incubated with CD80::GPI FSs, control FSs, or CTLA-4 mAbs plus anti-mouse-Ig conjugated to OG are shown (bold lines). Dotted lines indicate fluorescence obtained with native BW cells. Preincubation of CTLA-4 transfected BW cells with soluble CD80-Ig fusion protein (2 μg) was used as specificity control. Data are representative of 4 experiments.
Figure 6.
Figure 6.
FSs decorated with complex combinations of the IL-2R bind to target cells expressing membrane-bound IL-2 and dose-dependently bind soluble IL-2. A) Overlay histograms of HEK-293 cells expressing membrane-bound IL-2::GPI (single cell clone), which were incubated with control FSs (top panel), IL-2R γ-chain::GPI FSs (second panel), IL-2R βγ-chain::GPI FSs (third panel), or IL-2R αβγ-chain::GPI FSs (bottom panel) (bold lines). Dotted lines represent fluorescence of control transfected HEK-293 cells incubated with the respective FSs. B) Geometric mean + sd fluorescence values of IL-2::GPI (black bars) or control (white bar) HEK-293 transfectants stained with the indicated FSs from 3 independently performed experiments. *P < 0.05, ***P < 0.001; paired, 2-tailed Student’s t test. ns, P > 0.05. C) Dissociation kinetics of IL-R FSs from IL-2+ target cells. Dissociation of IL-2R αβγ::GPI FSs and IL-2R βγ::GPI from IL-2+ HEK-293 cells was monitored after removing excess FSs and chasing at RT, 37°C, and 37°C in the presence of 4 × 10⁴ U soluble IL-2. MFI was determined and plotted as percentage of maximum, corresponding to the values obtained at start of chase. D) Binding capacity of IL-2R αβγ::GPI FSs. D) Constant amounts of 125I IL-2 (2.5 ng) were incubated with titrated amounts of IL-2R αβγ::GPI FSs or control FSs for 1 h at RT. Subsequently, FSs were collected by size-exclusion filtration and FS-bound 125I IL-2 determined by γ-counting. E) Constant amounts of soluble IL-2 (5 ng) were incubated with titrated amounts of IL-2R αβγ::GPI FSs or control FSs and added to 5 × 10³ HT-2 cells cultured in 96-well plates. After 48 h, [3H]- thymidine was added; cells were harvested 16 h later, and cell proliferation was determined. Data are mean ± sd values of triplicate cultures (n=2). ED50, effective dose 50%.
Figure 7.
Figure 7.
A) IL-2R αβγ::GPI+FSs neutralize proliferation of polyclonally activated PB T cells. PBMCs (105) were cocultured with αCD3/αCD28 mAb-substituted microbeads and varying amounts of IL-2R αβγ::GPI or CD16::GPI (control) expressing FSs (starting with 2 μg/well) or medium alone. Cell proliferation was determined after 4 d by [3H]-thymidine uptake. Data are mean ± sd values of triplicate cultures (n=3). **P < 0.01 vs. control; paired, 2-tailed Student’s t test. B) Induction of antigen-specific unresponsiveness by FSs. Art v 1 allergen-specific Vα17/Vβ18 TCR tg PB T cells (105) were cultured with the indicated primary stimuli, and proliferation was measured by [3H]-thymidine incorporation for the last 12 h of a 72-h incubation (gray bars). Proliferation of T cells obtained on culture with indicated stimuli for 10 d, washed, and recultured with αCD3/αCD28 mAb-substituted microbeads in the absence (white bars) or presence (black bars) of exogenous IL-2 (500 U/ml). Data show one representative experiment (n=3). *P < 0.05, **P < 0.01, ***P < 0.001; paired, 2-tailed Student’s t test. kcpm, kilocounts per minute.

Similar articles

Cited by

References

    1. Derdak S V, Kueng H J, Leb V M, Neunkirchner A, Schmetterer K G, Bielek E, Majdic O, Knapp W, Seed B, Pickl W F. Direct stimulation of T lymphocytes by immunosomes: virus-like particles decorated with T cell receptor/CD3 ligands plus costimulatory molecules. Proc Natl Acad Sci U S A. 2006;103:13144–13149. - PMC - PubMed
    1. Kueng H J, Leb V M, Haiderer D, Raposo G, Thery C, Derdak S V, Schmetterer K G, Neunkirchner A, Sillaber C, Seed B, Pickl W F. General strategy for decoration of enveloped viruses with functionally active lipid-modified cytokines. J Virol. 2007;81:8666–8676. - PMC - PubMed
    1. Leb V M, Jahn-Schmid B, Kueng H J, Schmetterer K G, Haiderer D, Neunkirchner A, Fischer G F, Hartl A, Thalhamer J, Steinberger P, Bohle B, Seed B, Pickl W F. Modulation of allergen-specific T-lymphocyte function by virus-like particles decorated with HLA class II molecules. J Allergy Clin Immunol. 2009;124:121–128. - PubMed
    1. Shimomura O, Johnson F H, Saiga Y. Extraction, purification and properties of aequorin, a bioluminescent protein from the luminous hydromedusan, Aequorea. J Cell Comp Physiol. 1962;59:223–239. - PubMed
    1. Haas J, Park E C, Seed B. Codon usage limitation in the expression of HIV-1 envelope glycoprotein. Curr Biol. 1996;6:315–324. - PubMed

Publication types

MeSH terms

LinkOut - more resources