. 2010 May;24(5):1552-71.
doi: 10.1096/fj.08-125856. Epub 2010 Jan 7.

MicroRNA-204/211 alters epithelial physiology

Affiliations

MicroRNA-204/211 alters epithelial physiology

Fei E Wang et al. FASEB J. 2010 May.

Abstract

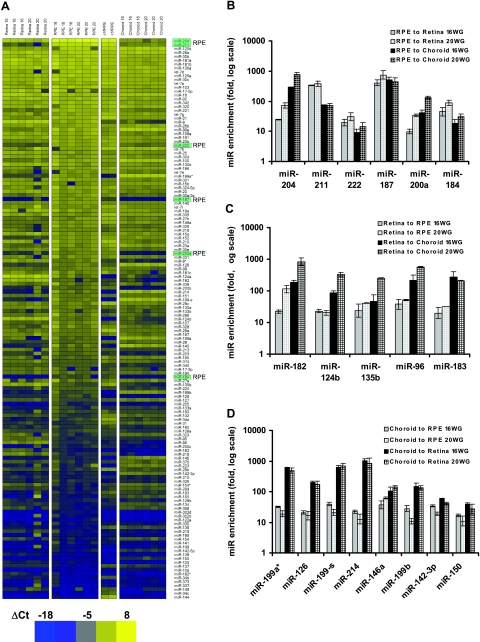
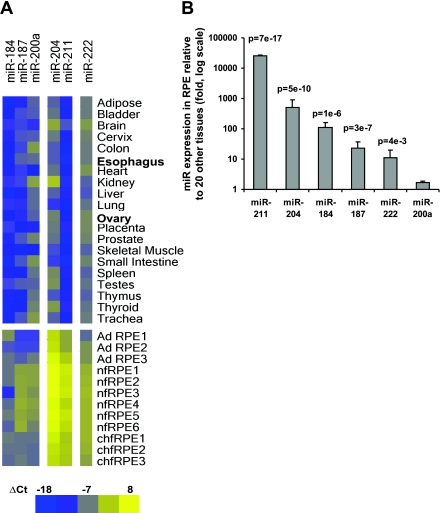
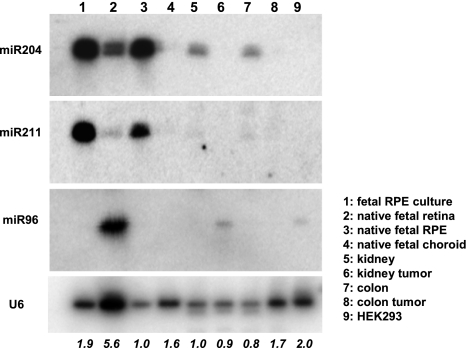
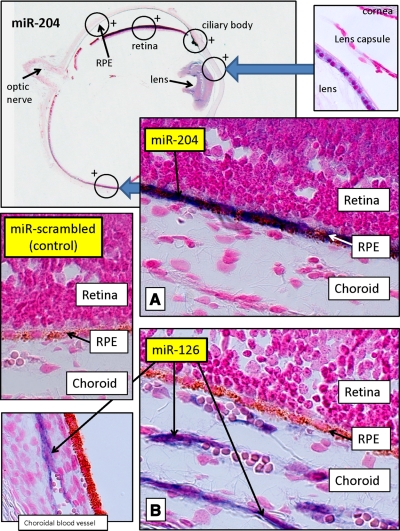
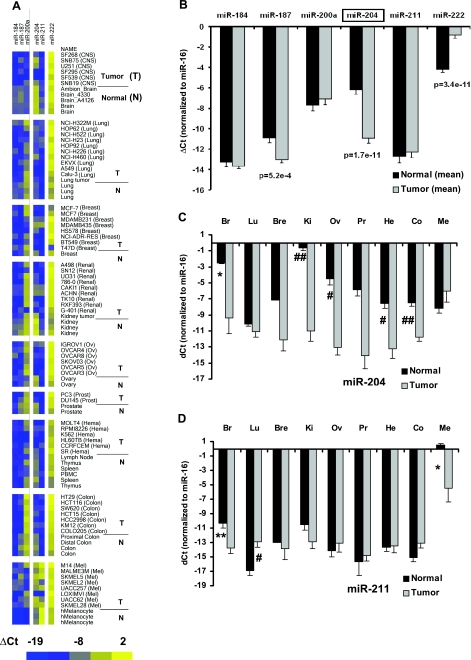
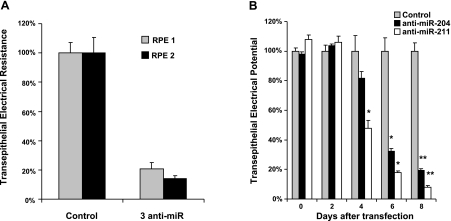
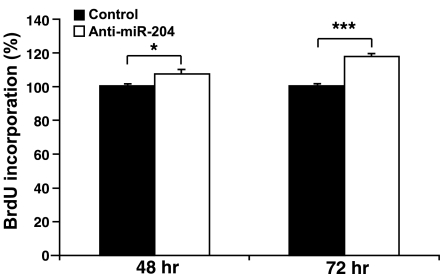
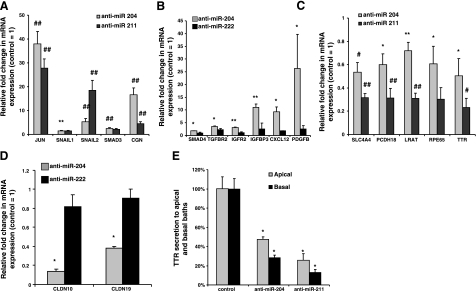
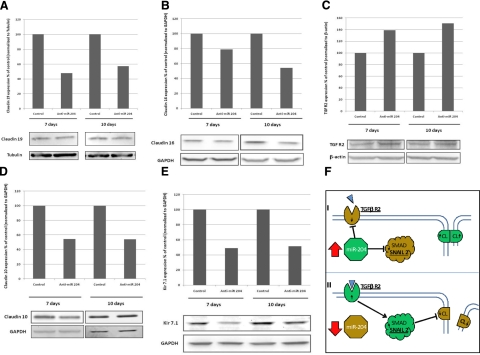
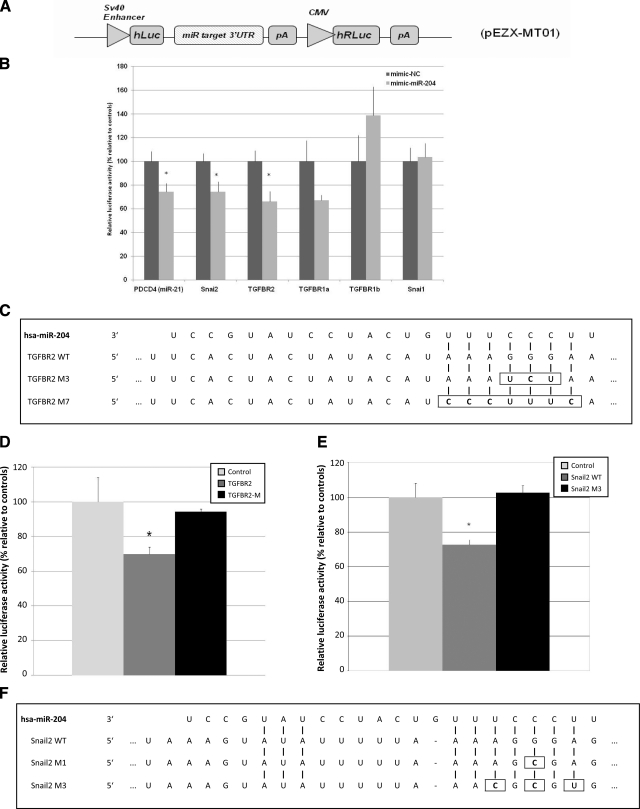
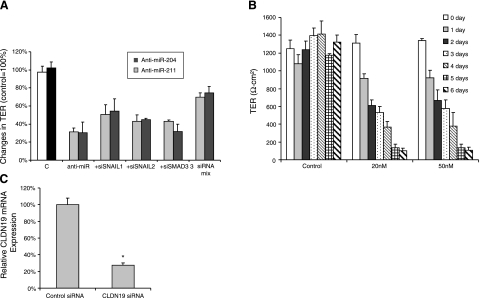
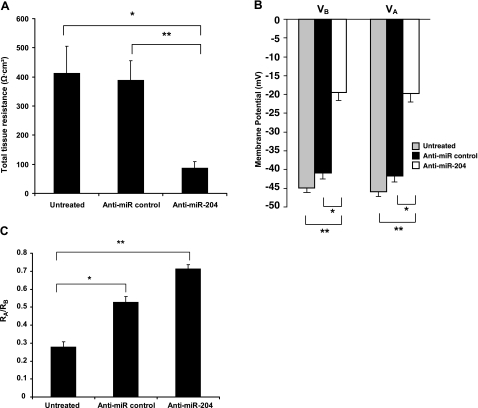
MicroRNA (miRNA) expression in fetal human retinal pigment epithelium (hfRPE), retina, and choroid were pairwise compared to determine those miRNAs that are enriched by 10-fold or more in each tissue compared with both of its neighbors. miRs-184, 187, 200a/200b, 204/211, and 221/222 are enriched in hfRPE by 10- to 754-fold compared with neuroretina or choroid (P<0.05). Five of these miRNAs are enriched in RPE compared with 20 tissues throughout the body and are 10- to 20,000-fold more highly expressed (P<0.005). miR-204 and 211 are the most highly expressed in the RPE. In addition, expression of miR-204/211 is significantly lower in the NCI60 tumor cell line panel compared with that in 13 normal tissues, suggesting the progressive disruption of epithelial barriers and increased proliferation. We demonstrated that TGF-beta receptor 2 (TGF-betaR2) and SNAIL2 are direct targets of miR-204 and that a reduction in miR-204 expression leads to reduced expression of claudins 10, 16, and 19 (message/protein) consistent with our observation that anti-miR-204/211 decreased transepithelial resistance by 80% and reduced cell membrane voltage and conductance. The anti-miR-204-induced decrease in Kir7.1 protein levels suggests a signaling pathway that connects TGF-betaR2 and maintenance of potassium homeostasis. Overall, these data indicate a critical role for miR-204/211 in maintaining epithelial barrier function and cell physiology.


Figures

Figure 1
Figure 1
miRNA expression profile in native hfRPE, neuroretina, choroid, and primary cultures of hfRPE. A) Heat map was plotted in Heatmap Builder1.0 with ΔCt from each miRNA using the mean Ct of miR-16 and let-7a as the reference. Yellow denotes high expression; blue denotes relatively lower expression. Entire data set was assigned to 50 color bins and sorted based on ΔCt in an RPE sample, with high expression (low ΔCt) at top and low expression (high ΔCt) at bottom. At right, the 6 most highly enriched RPE miRNAs are highlighted in light green. Intensity scale: bright blue indicates lowest expression (ΔCt=−18); bright yellow indicates highest expression (ΔCt=8). Highest and lowest expression levels differ by ≈7 × 10⁷-fold (226), which is within the detection range of TaqMan Q-PCR for miRNAs . B) Six miRNAs enriched in human RPE. Fold difference was calculated using average ΔΔCt from 3 biological repeats. A miRNA is considered as enriched in RPE if its expression level is significantly higher (≥10-fold) than that in neuroretina and choroid at both 16 and 20 WG. Student’s t test was run for each of the 4 pairs of comparison (P<0.05, 2-tailed, unpaired, unequal variance). C, D) Five miRNAs enriched in human neuroretina (C) and 8 miRNAs enriched in human choroid (D). Fold difference was calculated using the same criteria as for RPE in A.
Figure 2
Figure 2
Comparison of the 6 enriched miRNAs in native hfRPE, adult RPE, hfRPE primary culture, and a panel of 20 normal human tissues (Materials and Methods) using qRT-PCR. A) Heat map of ΔCt for 6 miRNAs in 20 normal tissues, 3 native adult human RPE (AD RPE), 5 native fetal RPE (nfRPE), and 3 primary cultures of native hfRPE (chfRPE). Because the expression for miR-16 is more consistent than that for let-7a across this sample of different tissues, it was used in the normalization for ΔCt in each tissue. B) miRNA expression in cultured hfRPE (n=3) compared with the average of miR expression levels in 20 tissues using the ΔΔCt method. P value is based on Student’s t test. Intensity scale: bright blue indicates lowest miRNA expression (ΔCt=−18); bright yellow indicates highest miRNA expression (ΔCt=8). These experiments were performed before the pooled 16 and 20 WG expression data and therefore do not include miR-200b and miR-221.
Figure 3
Figure 3
Northern blot expression of miR-204, miR-211, and miR-96 was analyzed by Northern blots with LNA-spiked and 32P-labeled oligonucleotides as probes. RNA of human fetal retina (lane 2), RPE (lane 3), and choroid (lane 4) were pooled from 3 individual donors. RNA of cultured RPE (lane 1) was obtained from passage 1 of hfRPE primary cultures. Total RNAs of normal and malignant adult human kidney (lanes 5 and 6) and colon (lanes 7 and 8) were purchased from Ambion. Total RNA (10 μg) from each preparation was loaded onto a 15% acrylamide gel. Native (lane 3) as well as cultured (lane 1) RPE is shown here highly enriched in the mature form of miR-204 and miR-211 compared with its adjacent tissues of neural retina, and choroid (lanes 2 and 4 respectively). Also, miR204 is readily detected in normal kidney (lane 5) and colon (lane 7) but is virtually undetected in the malignant counterparts of kidney (lane 6) and colon (lane 8). miR-96 is shown highly enriched in retina (lane 2) but not detected in either cultured or native RPE (lanes 1 and 3. respectively) or choroid (lane 4). RNA from HEK293 cells (lane 9) was included as a control. Hybridization to the U6 small nuclear RNA was used as the control for loading variations. Hybridization signals were visualized with a phosphor imaging screen on a Typhoon 9410 scanner. Loading variations were quantified by ImageQuant, normalized to the native RPE (lane 3), and expressed as fold changes at the bottom.
Figure 4
Figure 4
MiR-204 expression in the human eye. Cross sections of human fetal eye processed for miRNA ISH with Dig-labeled LNA probes to label miR-204. Sections were counterstained with Fast Red (red) to contrast eye structures. Top left: low-gain (×2) ISH image of entire eye section labeled for miR-204. Large amounts of MiR-204 were detected (blue) in RPE and in several other regions of eye, as indicated by circles with +. Top right inset: high-gain (×100) view of the area where positive miR-204 staining was detected in lens epithelia. A) High-gain (×100) ISH photograph of the eye section marked by the circle in the top left panel, showing intense blue staining, corresponding to large amounts of miR-204 in RPE. Weak staining for miR-204 was also detected in retina. B) Corresponding area to miR-204 magnified view in an adjacent section shows a high-gain (×100) ISH image for miR-126 labeling. miR-126, choroid enriched miR, was used as positive control and was only detected in choroid. Bottom left inset: area of the miR-126-labeled section where choroidal endothelial cells are positive. Middle left inset: scrambled miR probe from Exiqon was used as a negative control and showed no detectable labeling for RPE, choroid. or other parts of the eye.
Figure 5
Figure 5
Expression profile for miRNAs in tumor cell lines and normal tissues using qRT-PCR. ΔCt is the Ct value normalizedto Ct for miR-16 in each tissue. Data presented in panel A are quantitatively analyzed in panels B–D and are presented as means ± se. A) Heat map for ΔCt of 6 miRNAs in 62 tumor cell lines, 2 tumor tissues, and 25 normal tissues. Intensity scale: bright blue indicates lowest miRNA expression (ΔCt=−19); bright yellow indicates highest miRNA expression (ΔCt=2). Highest and lowest expression levels differed by ≈2 × 10⁶. B) Comparison of miRNA expression in tumor vs. normal tissues. ΔCt is averaged from all tumor cell lines and tissues and compared with the average from all normal tissues. C) Expression of miR-204 in 8 normal tissues and a primary culture of melanocytes vs. their matching tumor cell lines. Br, brain; Lu, lung; Bre, breast; Ki, kidney; Ov, ovary; Pr, Prostate; He, hematological cells; Co, colon; Me, melanocyte. Mean differences for breast and prostate tissue are not significant, probably because of the small sample size. D) Expression of miR-211 in 8 normal tissues and a primary culture of melanocytes vs. their matching tumor cell lines. *P < 0.05; **P < 0.01; #P < 0.005; ##P < 0.001.
Figure 6
Figure 6
TER significantly deceased in anti-miR-treated RPE. A) TER decreased in cells transfected with a mixture of 3 anti-miRs. Control: Dharmacon anti-miRNA-negative control 2, 600 nM. Treatment: 3 anti-miRs combined (anti-miR-204, anti-miR-211, and anti-miR-222); 200 nM for each. Cells derived from different tissues were transfected in triplicate for each group in 2 separate experiments. TER was normalized as a percentage of mean TER for control transfection. B) TER deceased over time in anti-miRNA-treated RPE. Cells were repeatedly transfected with control anti-miR, anti-miR-204, or anti-miR-211 (n=3) every 3 d. Resistances were measured every 2 d and normalized to control (100%). By 6 d, cells treated with anti-miR-204 or 211 have significantly lower RT. *P < 0.05; **P < 0.005.
Figure 7
Figure 7
Confluent monolayers of hfRPE cell cultures were transfected with anti-miR-204 or anti-miRNA negative control oligonucleotide on d 1 and 4. Cells were collected on d 5, and BrdU incorporation experiments were performed using a cell proliferation ELISA BrdU kit. Transfection with anti-miR-204 significantly increased cell proliferation (≈7.4%, 48 h; ≈17.5%, 72 h) compared with control (n=8). *P < 0.05; ***P < 0.001).
Figure 8
Figure 8
Gene expressions were up- or down-regulated in anti-miRNA-treated RPE. qRT-PCR for different genes was performed using cells treated with anti-miR-204 or anti-miR-211. Anti-miRNA derived from C. elegans and anti-miR-222 are controls that have no significant effect on TER A) Transcription factors Jun, SNAIL1, SNAIL2, Smad3, and cingulin (CGN) mRNA were assayed in anti-miR-204- or anti-miR-211-treated cells (n=6). B) Smad4, TGF-βR2 (TGFBR2), IGFR2, IGFBP3, CXCL12, and platelet-derived growth factor B (PDG) expression in anti-miR-204- or anti-miR-211-treated cells (n=4). C) SLC4A4, PCDH18, LRAT, TTR, and RPE65 are down-regulated in anti-miR-211- or anti-miR-204-treated cells (n=6). D) Claudin 10 and 19 expression in anti-miR-204-treated cells. Anti-miR-222 is a control (n=4). E) TTR secretion assayed by ELISA in cell culture medium. Cells were transfected with anti-miR-204/211 for 6 d. Fresh medium was added at d 6, and samples were collected 3 d later for ELISA. For all panels, data are means ± se from triplicates vs. anti-miR control. *P < 0.05; **P < 0.01; #P < 0.005; ##P < 0.001.
Figure 9
Figure 9
Immunoblot analysis of protein regulation by miR-204. A–E) Confluent monolayers of hfRPE cell culture were transfected with anti-miR-204 or anti-miRNA negative control oligonucleotide. Cells were collected on d 7 and 10, and 20 μg of total proteins was loaded and electrophoresed. Antibody-specific bands for claudin 19 (A), claudin 16 (B), TGF-βR2 (C), claudin 10 (D), and Kir7.1 (E) are ∼29, 26, 73, 22, and 40 kDa, respectively; GAPDH or β-actin was used as a loading control. Transfection with anti-miR-204 decreased protein expression of claudin 19, claudin 16, claudin 10, and Kir7.1. In contrast, the protein level of TGF-βR2 was increased compared with the negative control. Data are representative from ≥3 separate experiments. F) Schematic model of the miR204 regulatory pathway affecting claudin (CL) expression.
Figure 10
Figure 10
A) Schematic diagram of the luciferase reporter vector pEZX-MT101. SV40, simian virus 40. B) Results of the luciferase assay demonstrating direct binding between miR-204 and its potential target mRNAs. Relative level of luciferase activity is measured by the ratio of firefly vs. Renilla luciferase activities normalized to mimic-NC (control mimic, a C. elegans miRNA that shares minimal sequence similarity to mammalian miRNAs). Data points are means ± se of 3 separate experiments. Candidate is considered a direct target if the magnitude of decrease in luciferase activity is equal to or greater than what is measured for miR-21 and its known target PDCD4 3′-UTR (positive control) . C) Alignments between hsa-miR-204 and its seed binding sequence in the 3′-UTR of TGF-βR2. In the M3 and M7 mutants of the pEZX-MT01 TGF-βR2-3′-UTR vector either 3-bp (M3) or 7-bp (M7) mutations were introduced within the seed binding sequence of the wild-type 3′-UTR by site-directed mutagenesis. D) Validation of TGF-βR2 as a direct target of miR-204 by site-directed mutagenesis. HEK293 cells were either transfected with a TGF-βR2 or a TGF-βR2 M7 or cotransfected with either the wild-type (TGF-βR2) or M7 version of the pEZX-MT01 TGF-βR2-3′-UTR vector with a miR-204 mimic, and the luciferase activity was normalized to vector only control (control, as 100%). E) Luciferase activities mediated by the 3′-UTR of the human SNAIL2 in the reporter construct pEZX-MT01 SNAIL2–3′-UTR. HEK293 cells in triplicate were treated as in D. F) Sequence alignments of the seed region of hsa-miR-204 with its target site in the 3′-UTR of human SNAIL2. WT, wild-type sequence of the target site; M1 and SNAIL2 M3, mutants of the wild-type target with 1- or 3-bp substitutions (enclosed by rectangles). Values are means ± se of 3 separate experiments. Values of P < 0.05 were considered significant; Student’s t test.
Figure 11
Figure 11
A) Blocking transcription factors rescues anti-miRNA-induced decrease in TER. Cultured hfRPE cells were transfected with anti-miRNA or anti-miRNA plus siRNA for specific genes. Transepithelial resistance was measured on the first and last day during the experiments. Cells were treated with either anti-miR-204, anti-miR-211, anti-miR + siRNA for SNAIL1, anti-miRNA + siRNA for SNAIL2, anti-miR + siRNA for Smad3, anti-miR-211 + siRNA mixtures for SNAIL1, SNAIL2, and Smad3. In each case, anti-miRNA concentrations were 200 nM; siRNAs were 100 nM each. B) Claudin 19 siRNA induced a significant decrease in TER. Primary cultures of hfRPE were transfected twice at t = 0 and at 3 d with claudin 19 siRNA at 20 or 50 nM. TER was recorded daily by EVOM. C) Claudin 19 (CLDN19) mRNA was assayed with qRT-PCR in cells transfected with claudin 19 siRNA for 2 d. *P < 0.001.
Figure 12
Figure 12
Anti-miR-204 induced changes in membrane voltage and resistance in primary cultures of hfRPE. In these experiments, the initial TER of the Transwells were uniform as measured by EVOM (866±51 Ω · cm2; n=20). A) TER was measured after mounting confluent monolayers in a modified Üssing chamber. Data are means ±se (n=7). *P < 0.05; **P < 0.005. B) Membrane potentials and resistances were measured using intracellular microelectrode recording techniques (see Materials and Methods): VA, apical membrane potential; VB, basolateral membrane potential. *P < 2 × 10⁻¹⁰; **P < 2 × 10⁻¹³. C) RA/RB, ratio of apical-to-basolateral membrane resistance. *P < 3 × 10⁻⁵; **P < 10−13.

Similar articles

Cited by

References

    1. Shin K., Fogg V. C., Margolis B. Tight junctions and cell polarity. Annu Rev Cell Dev Biol. 2006;22:207–235. - PubMed
    1. Bryant D. M., Mostov K. E. From cells to organs: building polarized tissue. Nat Rev Mol Cell Biol. 2008;9:887–901. - PMC - PubMed
    1. Van Itallie C. M., Anderson J. M. Claudins and epithelial paracellular transport. Annu Rev Physiol. 2006;68:403–429. - PubMed
    1. Hou J., Renigunta A., Gomes A. S., Hou M., Paul D. L., Waldegger S., Goodenough D. A. Claudin-16 and claudin-19 interaction is required for their assembly into tight junctions and for renal reabsorption of magnesium. Proc Natl Acad Sci U S A. 2009;106:10350–10355. - PMC - PubMed
    1. Fisher S. K., Steinberg R. H. Origin and organization of pigment epithelial apical projections to cones in cat retina. J Comp Neurol. 1982;206:131–145. - PubMed

MeSH terms

Substances