. 2010 Mar;21(3):448-59.
doi: 10.1681/ASN.2009010045. Epub 2010 Jan 7.

Angiotensin II promotes development of the renal microcirculation through AT1 receptors

Affiliations

Angiotensin II promotes development of the renal microcirculation through AT1 receptors

Kirsten Madsen et al. J Am Soc Nephrol. 2010 Mar.

Abstract

Pharmacologic or genetic deletion of components of the renin-angiotensin system leads to postnatal kidney injury, but the roles of these components in kidney development are unknown. To test the hypothesis that angiotensin II supports angiogenesis during postnatal kidney development, we quantified CD31(+) postglomerular microvessels, performed quantitative PCR analysis of vascular growth factor expression, and measured renal blood flow by magnetic resonance. Treating rats with the angiotensin II type 1 receptor antagonist candesartan for 2 weeks after birth reduced the total length, volume, and surface area of capillaries in both the cortex and the medulla and inhibited the organization of vasa recta bundles. In addition, angiotensin II type 1 antagonism inhibited the transcription of angiogenic growth factors vascular endothelial growth factor, angiopoietin-1, angiopoietin-2, and the angiopoietin receptor Tie-2 in cortex and medulla. Similarly, Agtr1a(-/-);Agtr1b(-/-) mouse kidneys had decreased angiopoietin-1, angiopoietin-2, and Tie-2 mRNAs at postnatal day 14. To test whether increased urinary flow leads to microvascular injury, we induced postnatal polyuria with either lithium or adrenalectomy, but these did not alter vascular endothelial growth factor expression or vasa recta organization. Compared with vehicle-treated rats, renal blood flow was significantly (approximately 20%) lower in candesartan-treated rats even 14 days after candesartan withdrawal. Taken together, these data demonstrate that angiotensin II promotes postnatal expansion of postglomerular capillaries and organization of vasa recta bundles, which are necessary for development of normal renal blood flow.


Figures
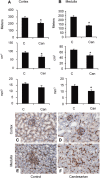
Figure 1.
Figure 1.
(A) Quantitative stereologic estimations of kidney cortical peritubular capillaries in control rats (C; n = 10) and in candesartan-treated animals (Can; 1 mg/kg per d, P1 to P13; n = 10). Total length (in meters; top) and surface area (in cm2; middle) of microvessels were significantly decreased after AT1 receptor inhibition. Total volume in mm3 (bottom) was not affected. Data are means ± SEM. *P < 0.05. (B) Quantitative stereologic estimations of kidney medullary CD31+ microvessels including vasa recta in control rats (C; n = 10) and in candesartan-treated animals (Can; 1 mg/kg per d, P1 to P13; n = 10). Total length in meters, surface area in cm2, and volume in mm3 were significantly decreased in response to AT1 receptor inhibition. Data are means ± SEM, *P < 0.05. (C and D) Immunohistochemical staining of kidney cortex for the endothelial cell marker CD31. (C) In control rats, cortex displayed a dense capillary network in which virtually all tubular cells were directly apposed to endothelial cells and distinct labeling of glomerular capillaries. (D) In candesartan-treated rats, the capillary network was less widespread with increased tubular-endothelial distance(n = 10 in each group). Bar = 50 μm. (E and F) Immunohistochemical staining of cross-sections of renal outer medulla with an antibody specific for the endothelial cell marker CD31. (E) Sections from control rat pups displayed distinct vasa recta bundles and capillaries. (F) Candesartan-treated rats showed disrupted vasa recta architecture and abnormally thickened capillaries (n = 10 animals in each group). Bar = 50 μm.
Figure 2.
Figure 2.
(A) Vascular growth factor and growth factor receptor mRNA levels in rat kidney cortex measured by quantitative PCR in control rats (n = 9) and in candesartan-treated rats at P14 (1 mg/kg per d; n = 9). AT1 receptor blockade in the postnatal period resulted in significantly decreased mRNA levels of VEGF, angiopoietin-1, and angiopoietin-2. Growth factor receptor expression was not affected. Messenger RNA level is shown relative to 18S rRNA level and is expressed as the percentage change from the expression level in control animals. Columns show means ± SEM. *P < 0.05. (B) Vascular growth factor and growth factor receptor mRNA levels in rat kidney medulla measured by quantitative PCR in control rats (n = 9) and in candesartan-treated rats at P14 (1 mg/kg per d; n = 9). AT1 receptor inhibition in the postnatal period resulted in significantly suppressed levels of VEGF, angiopoietin-1, and angiopoietin-2 mRNAs and, in addition, in impaired growth factor receptor mRNAs (Flt, Flk, and Tie-2). Messenger RNA level is shown relative to 18S rRNA level and is expressed as the percentage change from the expression level in control animals. Columns show means ± SEM. *P < 0.05; **P < 0.01. (C) Vascular growth factor and growth factor receptor mRNA levels in AT1A/1B−/− double-knockout mouse kidneys (n = 9) and wild-type littermate kidneys at P14 (n = 9). AT1A/1B−/− mice displayed suppressed angiopoietin-1, angiopoietin-2, and Tie-2 mRNAs, whereas VEGF mRNA level was unaltered. The mRNA level of the products of interest are presented relative to 18S rRNA levels and are shown as the percentage change from the expression level in wild-type littermates. Columns show means ± SEM.*P < 0.05; **P < 0.01. (D) PCR analysis of microdissected outer medullary nephron segments from control rats (P14). VEGF mRNA was observed in OMCDs and in mTAL but not in descending thin limb of loop of Henle (DTL). AQP-2 served as a positive control for OMCD, sodium-potassium 2 chloride co-transporter (NKCC2) as positive control for mTAL, and AQP-1 as positive control for DTL. Negative controls were omission of reverse transcriptase (−RT) and addition of water instead of cDNA in the amplification. Size marker is ΦX174DNA/HaeIII fragments. (E) Western blotting experiment for VEGF protein abundance in kidney medulla homogenates from control (C; n = 9) and candesartan-treated rats (Can; 1 mg/kg per d; n = 8). *P < 0.05. (F) Amplification products for AT1A receptor mRNA was observed in OMCD and mTAL. Negative controls were omission of reverse transcriptase (−RT) and addition of water instead of cDNA in the amplification. Size marker is ΦX174DNA/HaeIII fragments. (G) Immunohistochemical labeling of rat kidney sections from P14 for VEGF. In control rats, distinct labeling of outer medullary tubular structures compatible with OMCD and mTAL segments was seen. In outer medulla from candesartan-treated rat pups (P1 to P13), fewer VEGF-positive tubular segments were present and the tissue appeared more irregular with fewer tubular profiles (n = 10 in each experimental group). Bar = 50 μm.
Figure 3.
Figure 3.
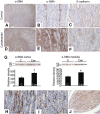
(A and B) Immunohistochemical staining of kidney sections from control rats at P14 (n = 8) with an antibody specific for α-SMA. α-SMA was restricted to preglomerular arteries and arterioles (A) and medullary vasa recta bundles (B). Bar = 500 μm in A and 50 μm in B (outer medulla). (D and E) Immunohistochemical staining of kidney sections from candesartan-treated rat pups (1 mg/kg per d, P1 to P13; n = 8) for α-SMA. Immunolabeling was associated with preglomerular vessels. α-SMA–positive spindle-shaped cells populated predominantly the outer medullary interstitium and cortical medullary rays (E). Bar = 500 μm in D and 50 μm in E. (C and F) Immunohistochemical staining of outer medulla from control and candesartan-treated rats (1 mg/kg per d, P1 to -P13) with an antibody specific for E-cadherin. Distinct E-cadherin labeling was associated with renal tubules, most clearly collecting ducts, in both control and AT1 inhibitor–treated animals. Cells populating the outer medullary interstitium in candesartan-treated animals were negative for E-cadherin (n = 8). Bar = 50 μm. (G) Western blotting experiments for α-SMA protein abundance in kidney tissue homogenates from control (C; n = 9) and candesartan-treated rats (Can; 1 mg/kg per d; n = 8). A band of 42 kD was detected for α-SMA. AT1 receptor inhibition resulted in increased α-SMA protein abundance in both cortex and medulla compared with control animals. Columns show means ± SE. *P < 0.05. (H through J) Immunohistochemical staining of outer medulla (H and I) and inner medulla (J) from control (H) and candesartan-treated rats (I and J; 1 mg/kg per d, P1 to P13) with an antibody specific for the stem cell marker CD133. Distinct CD133 labeling was associated with endothelial cells and confirmed irregular vasa recta bundle organization after candesartan treatment (H versus I). (I) Interstitial cells in outer medulla were negative for CD133. (J) CD133+ interstitial cells appeared in candesartan-treated rat kidney inner medulla. Bars = 50 μm in H and I and 200 μm in J.
Figure 4.
Figure 4.
(A) The bar graph shows the effect of Li treatment from P0 to P14 on VEGF mRNA levels in rat kidney cortex and medulla as measured by quantitative PCR. C, control (n = 10); Li, Li-treated rats (50 mmol/kg chow; n = 5). There was no significant effect of Li treatment on mRNA level of VEGF. Messenger RNA level is shown relative to TATA-box binding protein (TBP) RNA level. Columns show means ± SEM. (B) Immunohistochemical labeling of kidney section from Li-treated rat (P0 to P14) for the endothelial marker CD31. A descending vasa recta bundle at the cortical outer medulla junction is seen. Bar = 50 μm. In each experimental group, n = 5. (C) Immunohistochemical labeling of rat kidney sections from control rats (n = 5) and Li-treated rats (n = 5) for VEGF (P0 to P14, 50 mmol/kg chow). There was no difference in the labeling pattern; the micrograph shows immunoreactive VEGF protein associated with outer medullary tubular structures compatible with OMCD and mTAL segments. Bar = 50 μm. (D) The graph shows the effect of ADX at P10 on VEGF mRNA levels in rat kidney at P20 as measured by quantitative PCR (sham-operated control n = 9, ADX-treated rats n = 6). There was no significant effect of ADX on VEGF mRNA level. Messenger RNA level is shown relative to 18S rRNA level. Columns show means ± SEM. (E) The micrograph shows immunohistochemical labeling of kidney section for VEGF. The tissue was from rats adrenalectomized at P10 and analyzed at P20 (n = 4 to 5). A vasa recta bundle is not different from sham-operated rat kidney at the cortical outer medulla junction is seen. Bar = 50 μm. (F) Effect of ADX at P10 on VEGF immunoreactivity in rat kidney. Sections were from P20 and show tissue from sham-operated control rats and adrenalectomized rats (n = 4 to 5). There was no difference in the labeling pattern; immunoreactive protein was associated with outer medullary tubular structures compatible with OMCD and mTAL segments. Bar = 50 μm.
Figure 5.
Figure 5.
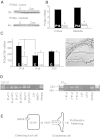
(A) Western blotting experiments for the proliferation marker PCNA in homogenates from control rat kidney cortex and medulla (n = 5) and candesartan-treated (P1 to P13, 1 mg/kg per d) rat kidney cortex (n = 4) and medulla (n = 4). Expected size is 42 kD. No changes in PCNA protein abundance was seen between the two experimental groups. (B) Effect of rat age on PCNA mRNA level in kidney cortex and medulla. Kidney tissue was from P14 and adult rats (>2 months). PCNA mRNA expression was significantly decreased in both cortex and medulla from adult rats compared with P14. Columns show means ± SEM (SE not visible; n = 3 in each group). (C) PCNA mRNA level in vasa recta bundles microdissected from rats treated with vehicle or candesartan (1 mg/kg per d) during one of the following time periods: P11 to P13 (n = 4 control, n = 4 candesartan), P13 to P15 (n = 4 control, n = 4 candesartan), or P17 to P19 (n = 4 control, n = 4 candesartan). AT1 receptor blockade at P11 to P13 but not at later stages resulted in significantly decreased PCNA mRNA in vasa recta bundles compared with the control group. The results are normalized to TBP mRNA level. Data are means ± SEM. *P < 0.05. Micrograph (right) shows a microdissected vasa recta bundle from rat outer medulla. (D) PCR analysis of microdissected vasa recta bundles for the endothelial marker CD31 (left; Can, candesartan; C, control; P, postnatal day) and AT1A receptor. CD31 and AT1A were readily amplified from all samples of microdissected vasa recta bundles. Negative controls were omission of reverse transcriptase (−RT) and cDNA (−cDNA). Size marker is ΦX174DNA/HaeIII fragments. (E) Schematic outline of proposed mechanisms. AngII through the AT1 receptor in collecting duct and loop of Henle epithelium supports expression of VEGF (and other vascular growth factors) that are released to the renal interstitium. VEGF and angiopoietins occupy cognate receptors end stimulate endothelial proliferation and vascular patterning in the cortex and the medulla.
Figure 6.
Figure 6.
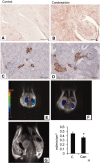
(A and B) α-SMA immunostaining of kidney sections from control rat (A) and a rat treated with candesartan (1 mg/kg per d, P1 to P13; B). Rats were not treated from P14 until P30. The renal papilla displayed significant injury at P30 (B versus A). (B) α-SMA–positive cells accumulated in the interstitium, especially in the outer medulla (n = 4). Bar = 200 μm. (C and D) At P30, labeling for α-SMA yielded positive signals from preglomerular arteries and arterioles. (D) Candesartan treatment (P1 to P14) resulted in thickened arterioles with hypertrophied media layer compared with control kidneys. Bar = 50 μm. (E and F) Representative images from magnetic resonance visualization show the relative intrarenal blood flow in rats treated with vehicle (E) or candesartan (1 mg/kg per d, P0 to P13; F). Red arrows indicate the site (aorta) where the arterial input function was obtained necessary in the kinetic analysis using a two-compartment model, describing the intravascular and extravascular spaces, respectively. (G) Control high-resolution image obtained by MRI for anatomic localization of kidneys and aorta in rat (P30) treated with vehicle from P1 to P13. (H) Effect of candesartan treatment from P1 to P13 followed by withdrawal from P14 to P30 on total RBF as measured by MRI at P30. Columns show means ± SE (n = 8 in each group). *P < 0.05.

Comment in

Similar articles

Cited by

References

    1. Cha J-H, Kim Y-H, Jung J-Y, Han K-H, Madsen KM, Kim J: Cell proliferation in the loop of Henle in the developing rat kidney. J Am Soc Nephrol 12: 1410–1421, 2001 - PubMed
    1. Friberg P, Sundelin B, Bohman S-O, Bobik A, Nilsson H, Wickman A, Gustafsson H, Petersen J, Adams MA: Renin-angiotensin system in neonatal rats: Induction of a renal abnormality in response to ACE inhibition or angiotensin II antagonism. Kidney Int 45: 485–492, 1994 - PubMed
    1. Guron G, Adams MA, Sundelin B, Friberg P: Neonatal angiotensin-converting enzyme inhibition in the rat induces persistent abnormalities in renal function and histology. Hypertension 29: 91–97, 1997 - PubMed
    1. Hilgers KF, Reddi V, Krege JH, Smithies O, Gomez RA: Aberrant renal vascular morphology and renin expression in mutant mice lacking angiotensin-converting enzyme. Hypertension 29: 216–221, 1997 - PubMed
    1. Nagata M, Tanimoto K, Fukamizu A, Kon Y, Sugiyama F, Yagami K, Murakami K, Watanabe T: Nephrogenesis and renovascular development in angiotensinogen-deficient mice. Lab Invest 75: 745–753, 1996 - PubMed

Publication types

MeSH terms