

Loss of MicroRNA-192 promotes fibrogenesis in diabetic nephropathy
- PMID: 20056746
- PMCID: PMC2831862
- DOI: 10.1681/ASN.2009050530
Loss of MicroRNA-192 promotes fibrogenesis in diabetic nephropathy
Abstract
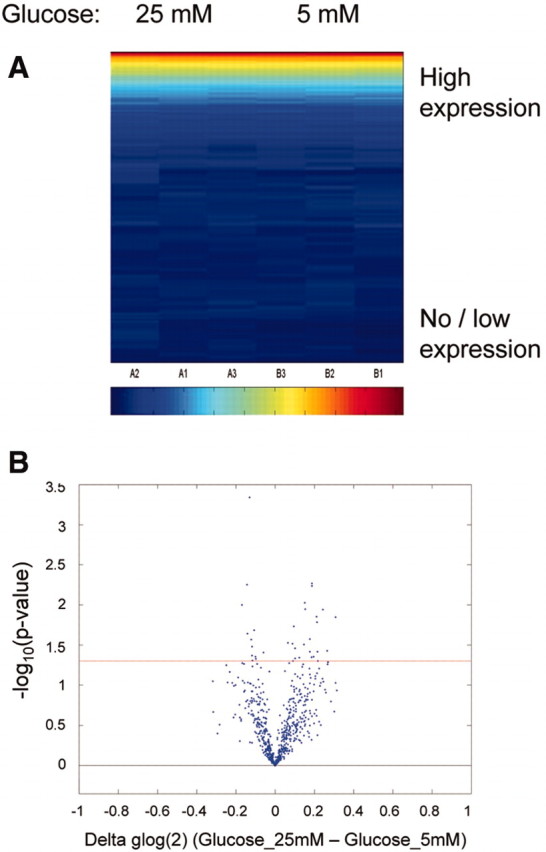
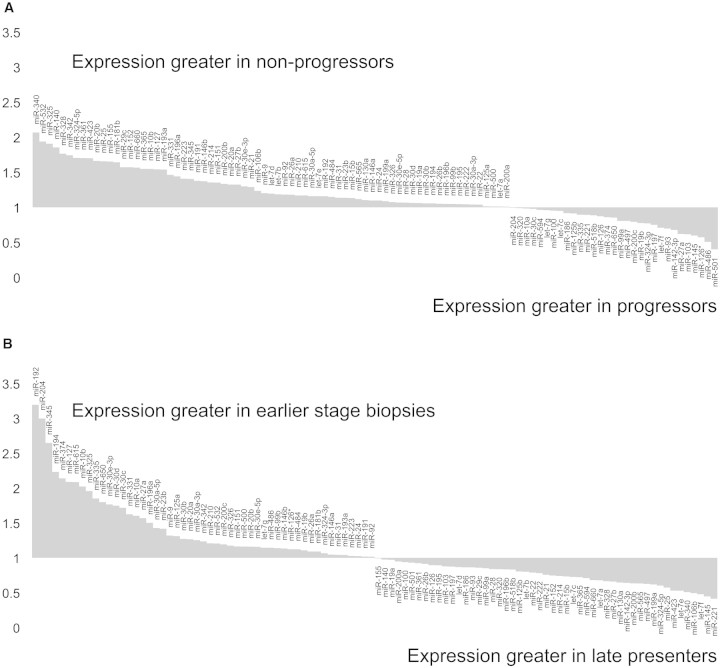
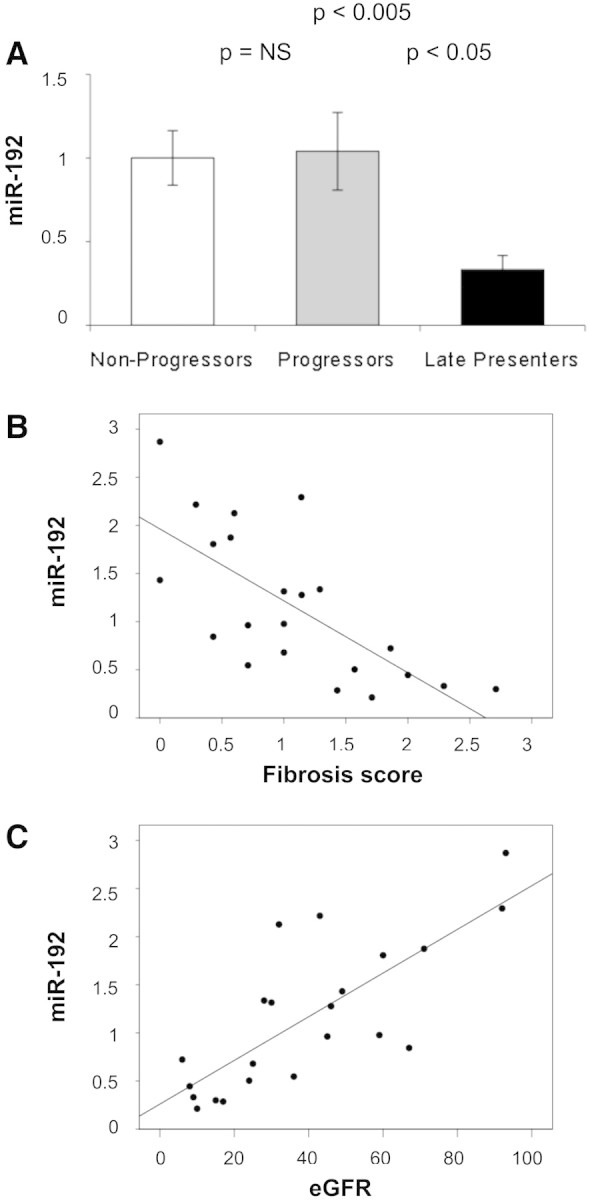
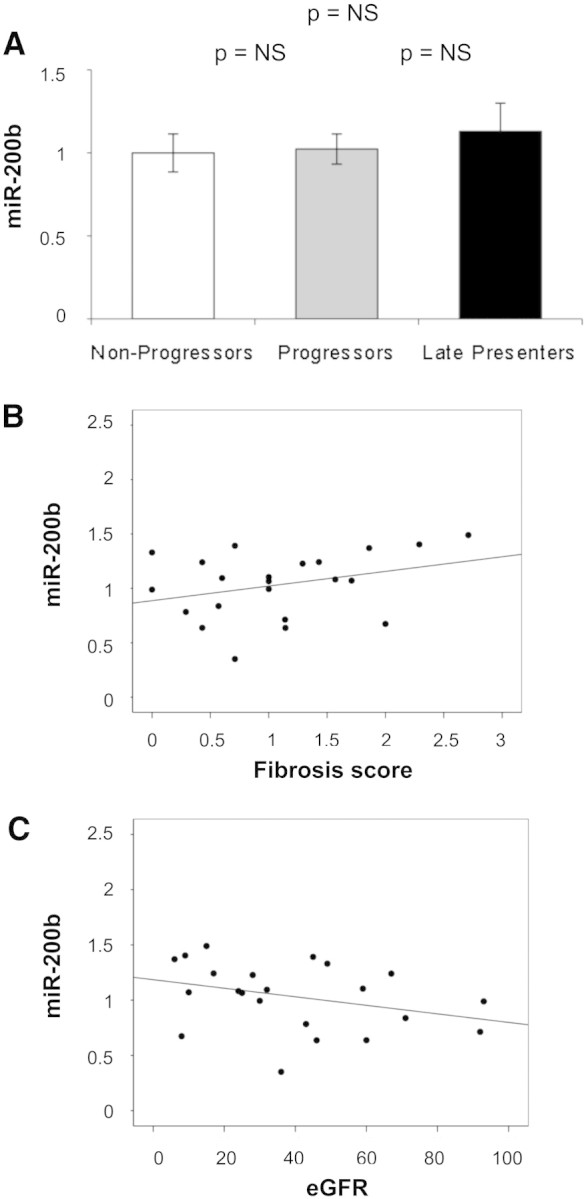
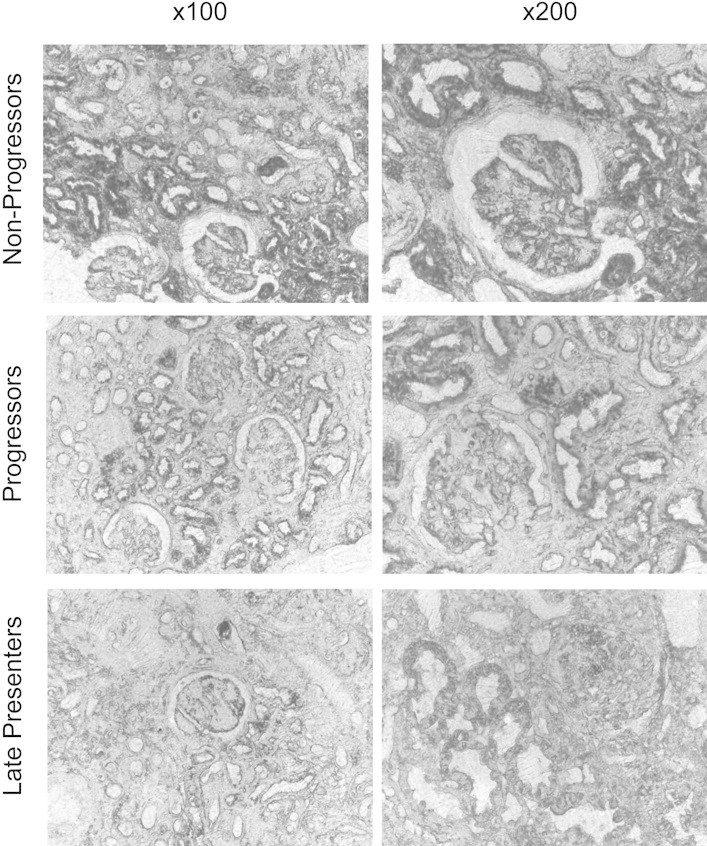
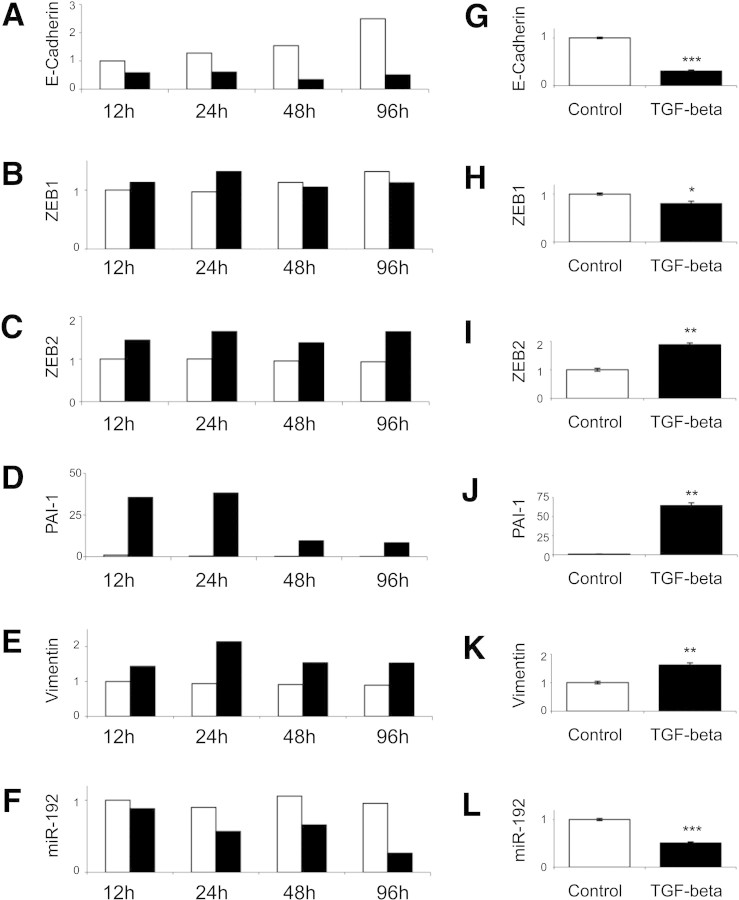
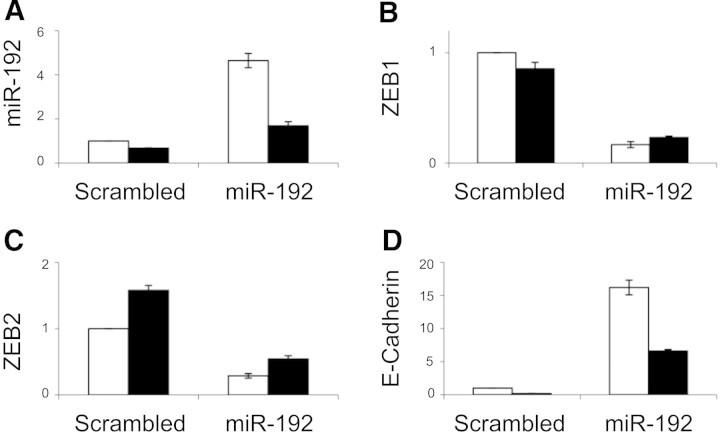
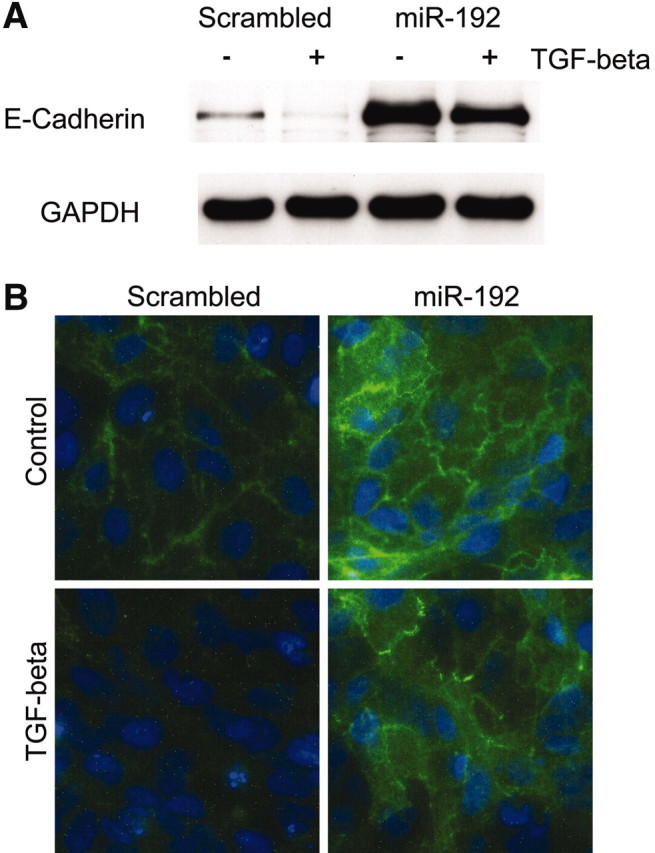
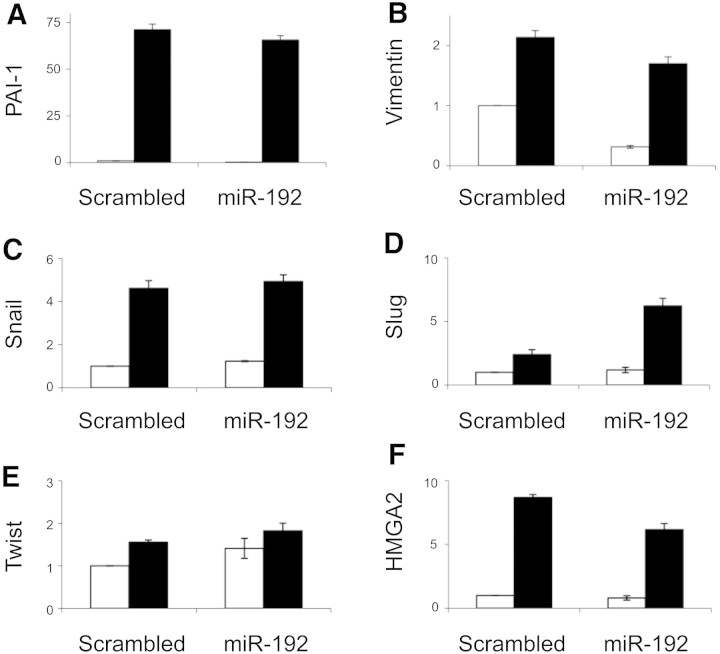
The role of microRNAs (miRs), which are endogenous RNA oligonucleotides that regulate gene expression, in diabetic nephropathy is unknown. Here, we performed expression profiling of cultured proximal tubular cells (PTCs) under high-glucose and control conditions. We identified expression of 103 of 328 microRNAs but did not observe glucose-induced changes in expression. Next, we performed miR expression profiling in pooled RNA from formalin-fixed, paraffin-embedded tissue from renal biopsies. We studied three groups of patients with established diabetic nephropathy and detected 103 of 365 miRs. Two miRs differed by more than two-fold between progressors and nonprogressors, and 12 miRs differed between late presenters and other biopsies. We noted the greatest change in miR-192 expression, which was significantly lower in late presenters. Furthermore, in individual biopsies, low expression of miR-192 correlated with tubulointerstitial fibrosis and low estimated GFR. In vitro, treatment of PTCs with TGF-beta1 decreased miR-192 expression. Overexpression of miR-192 suppressed expression of the E-Box repressors ZEB1 and ZEB2, thereby opposing TGF-beta-mediated downregulation of E-cadherin. In summary, loss of miR-192 expression associates with increased fibrosis and decreased estimated GFR in diabetic nephropathy in vivo, perhaps by enhancing TGF-beta-mediated downregulation of E-cadherin in PTCs.
Figures
Similar articles
-
MicroRNA-27a promotes renal tubulointerstitial fibrosis via suppressing PPARγ pathway in diabetic nephropathy.Oncotarget. 2016 Jul 26;7(30):47760-47776. doi: 10.18632/oncotarget.10283. Oncotarget. 2016. PMID: 27351287 Free PMC article.
-
High glucose down-regulates microRNA-181a-5p to increase pro-fibrotic gene expression by targeting early growth response factor 1 in HK-2 cells.Cell Signal. 2017 Feb;31:96-104. doi: 10.1016/j.cellsig.2017.01.012. Epub 2017 Jan 7. Cell Signal. 2017. PMID: 28077323
-
miR-21 promotes renal fibrosis in diabetic nephropathy by targeting PTEN and SMAD7.Clin Sci (Lond). 2015 Dec;129(12):1237-49. doi: 10.1042/CS20150427. Epub 2015 Sep 28. Clin Sci (Lond). 2015. PMID: 26415649
-
Diabetic nephropathy: the central role of renal proximal tubular cells in tubulointerstitial injury.Histol Histopathol. 2002 Jan;17(1):247-52. doi: 10.14670/HH-17.247. Histol Histopathol. 2002. PMID: 11813875 Review.
-
The proximal tubule in the pathophysiology of the diabetic kidney.Am J Physiol Regul Integr Comp Physiol. 2011 May;300(5):R1009-22. doi: 10.1152/ajpregu.00809.2010. Epub 2011 Jan 12. Am J Physiol Regul Integr Comp Physiol. 2011. PMID: 21228342 Free PMC article. Review.
Cited by
-
MicroRNAs in renal fibrosis.Front Physiol. 2015 Feb 20;6:50. doi: 10.3389/fphys.2015.00050. eCollection 2015. Front Physiol. 2015. PMID: 25750628 Free PMC article. Review.
-
MicroRNA-10 negatively regulates inflammation in diabetic kidney via targeting activation of the NLRP3 inflammasome.Mol Ther. 2021 Jul 7;29(7):2308-2320. doi: 10.1016/j.ymthe.2021.03.012. Epub 2021 Mar 17. Mol Ther. 2021. PMID: 33744467 Free PMC article.
-
Translational study of microRNAs and its application in kidney disease and hypertension research.Clin Sci (Lond). 2012 May 1;122(10):439-47. doi: 10.1042/CS20110159. Clin Sci (Lond). 2012. PMID: 22283365 Free PMC article. Review.
-
Triptolide Attenuates Podocyte Injury by Regulating Expression of miRNA-344b-3p and miRNA-30b-3p in Rats with Adriamycin-Induced Nephropathy.Evid Based Complement Alternat Med. 2015;2015:107814. doi: 10.1155/2015/107814. Epub 2015 May 20. Evid Based Complement Alternat Med. 2015. PMID: 26078766 Free PMC article.
-
TGF-β: the master regulator of fibrosis.Nat Rev Nephrol. 2016 Jun;12(6):325-38. doi: 10.1038/nrneph.2016.48. Epub 2016 Apr 25. Nat Rev Nephrol. 2016. PMID: 27108839 Review.
References
-
- Gregory PA, Bert AG, Paterson EL, Barry SC, Tsykin A, Farshid G, Vadas MA, Khew-Goodall Y, Goodall GJ: The miR-200 family and miR-205 regulate epithelial to mesenchymal transition by targeting ZEB1 and SIP1. Nat Cell Biol 10: 593–601, 2008 - PubMed
-
- Garzon R, Calin G, Croce CM: MicroRNAs in cancer. Annu Rev Med 60: 167–179, 2009 - PubMed
Publication types
MeSH terms
Substances
LinkOut - more resources
Full Text Sources
Other Literature Sources
Medical
Research Materials
